- 二值网络:自变量及其函数的值、向量分量的值只取0和1函数、向量。
- 权向量:W=(w1,w2,…,wn)
- 输入向量:X=(x1,x2,…,xn)
- 训练样本集:{(X,Y)|Y为输入向量X对应的输出}
- 初始化权向量W;
- 重复下列过程,直到训练完成:
2.1 对每个样本(X,Y),重复如下过程:
2.1.1 输入X;
2.1.2 计算o=F(XW);
2.1.3 如果输出不正确,则
当o=0时,取 W=W+X,
当o=1时,取 W=W-X
import random
import numpy as np
import math
import matplotlib.pyplot as plt
def func(x):
"""
函数说明:x中对应位置元素大于0记为1,否则记为0
x:列表
返回值:o,0,1列表
"""
o = []
for i in x:
if i > 0:
o.append(1)
else:
o.append(0)
return o
def main():
# 权值w
W = np.random.normal(0, 1, (2, 1))
# 偏执值
b = np.random.uniform(0, 1)
# 学习率
learn_rete = 0.2
# 输入
X = np.array([[1, 0], [1, 2], [2, 0], [2, 3], [3, 2], [4, 2], [4, 5], [5, 3], [0, 0], [3, 5]])
# 理想输出
Y = np.array([1, 0, 1, 0, 1, 1, 0, 1, 1, 0])
while True:
# 记录错误个数,当全部分类正确时,退出循环
count = 0
# 计算实际输出
o = func(np.dot(X, W) + b)
for i in range(10):
if Y[i] - o[i] > 0:
W += learn_rete * X[i].reshape(2, 1)
b += learn_rete * Y[i]
count += 1
elif Y[i] - o[i] < 0:
W -= learn_rete * X[i].reshape(2, 1)
b -= learn_rete * Y[i]
count += 1
else:
pass
if count == 0:
break
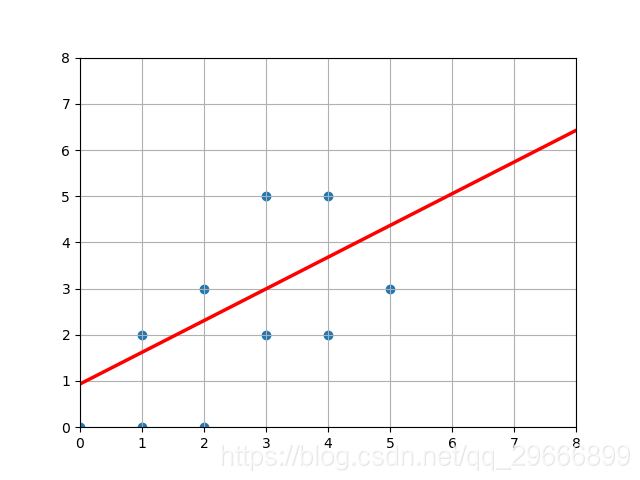
plt.figure()
# 画出所有点
x_sca = X[:, 0]
y_sca = X[:, 1]
plt.scatter(x_sca, y_sca)
# 斜率
r = -W[0][0] / W[1][0]
# 偏执值
bias = -b / W[1][0]
# 画直线
x = np.linspace(0, 8, 24)
y = r * x + bias
plt.plot(x, y, 'r', linewidth=2.5, linestyle="-")
# 坐标值
plt.xlim(0, 8)
plt.ylim(0, 8)
# 显示网格
plt.grid()
plt.show()
if __name__ == '__main__':
main()