指定图与x轴的纵向距离
data = np.random.normal(size=(20,6)) + np.arange(6)/2
sns.violinplot(data)
sns.despine(offset=10) #设置与x轴的距离
如图:

把左边的轴隐藏
sns.set_style('white')
sns.boxplot(data=data, palette='deep')
sns.despine(left=True)
结果为:

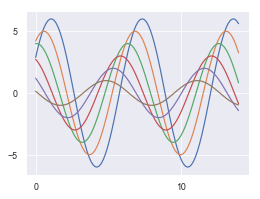
设置不同风格样式:
with sns.axes_style('whitegrid'):
plt.subplot(211)
sinplot()
plt.subplot(212) #在with域外的都是其它格式
sns.sinplot(-1)
如图:

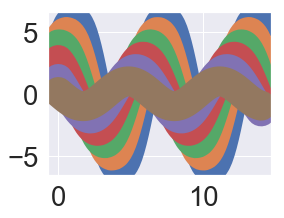
sns.set_context('paper')
plt.figure(figsize=(4,3))
sinplot()
sns.set_context('talk')
plt.figure(figsize=(4,3))
sinplot()
sns.set_context('notebook', font_scale=2.5, rc={"lines_linewidth" : 2.5 }) #字体大小与线宽
plt.figure(figsize(4,3))
sinplot()
如图: