版权声明:本文为博主原创文章,未经博主允许不得转载。 https://blog.csdn.net/messicr7/article/details/78544590
项目中用到了echarts的插件,其官网已经很好了,但是自己用到的比较具体,记录一下。
项目最终效果如下:

一、首先贴一下代码
引用echartsjs
<script type="text/javascript" src="${pageContext.request.contextPath}/eim/assets/echarts/echarts.min.js" ></script><script type="text/javascript" src="${pageContext.request.contextPath}/eim/assets/echarts/macarons.js" ></script>
<script type="text/javascript" src="${pageContext.request.contextPath}/eim/assets/echarts/macarons-blue.js" ></script><div id="mainchart" style="width: 100%;height:360px;"></div>
<div id="active" style="width: 100%;height:415px;"></div><script>
$(function(){
//倒计时
refreshOnTime();
//10秒请求一次
setInterval('refreshOnTime()', 10000);
});
// 基于准备好的dom,初始化echarts实例
var resourceChart = echarts.init(document.getElementById('mainchart'),
'macarons');
var activeChart = echarts.init(document.getElementById('active'),
'macarons');
// 指定图表的配置项和数据
resourceChart.setOption({
baseOption : {
title : {
text : '用户在线率/资源占用率',
textStyle : {
color : '#333',
fontStyle : 'normal',
fontWeight : "600",
fontFamily : "microsoft yahei",
fontSize : 16
}
},
tooltip : {
trigger : 'axis',
axisPointer : { // 坐标轴指示器,坐标轴触发有效
type : 'line' // 默认为直线,可选为:'line' | 'shadow'
},
formatter : function(params, ticket, callback) {
var res = params[0].name;
res += '<br/>' + params[0].seriesName + ' : '
+ params[0].value + '%';
if (params[1] != '') {
res += '<br/>' + params[1].seriesName + ' : '
+ params[1].value + '%';
}
if (params[2] != '') {
res += '<br/>' + params[2].seriesName + ' : '
+ params[2].value + '%';
}
setTimeout(function() {
callback(ticket, res);
}, 1)
return res;
}
},
legend : {
x : 'right',
data : [ '用户在线率', '磁盘', '内存' ]
},
grid : {
x : '55px',
y : '50px',
width : '95%'
},
xAxis : [ {
type : 'category',
boundaryGap : false,
data : []
} ],
yAxis : [ {
type : 'value',
axisLabel : {
formatter : '{value} %'
}
} ],
series : [ {
name : '用户在线率',
type : 'line',
data : []
}, {
name : '磁盘',
type : 'line',
data : []
}, {
name : '内存',
type : 'line',
data : []
} ]
},
media : [ {
query : {
maxWidth : 435
},
option : { // 这里写此规则满足下的option。
title : {
text : '用户在线率/资源占用率',
textStyle : {
color : '#333',
fontStyle : 'normal',
fontWeight : "600",
fontFamily : "microsoft yahei",
fontSize : 16
}
},
tooltip : {
trigger : 'axis',
axisPointer : { // 坐标轴指示器,坐标轴触发有效
type : 'line' // 默认为直线,可选为:'line' | 'shadow'
},
formatter : function(params, ticket, callback) {
var res = params[0].name;
res += '<br/>' + params[0].seriesName + ' : '
+ params[0].value + '%';
if (params[1] != '') {
res += '<br/>' + params[1].seriesName + ' : '
+ params[1].value + '%';
}
if (params[2] != '') {
res += '<br/>' + params[2].seriesName + ' : '
+ params[2].value + '%';
}
setTimeout(function() {
callback(ticket, res);
}, 1)
return res;
}
},
legend : {
left : 'center',
bottom : 0,
orient : 'horizontal',
data : [ '用户在线率', '磁盘', '内存' ]
},
grid : {
x : '55px',
y : '50px',
width : '95%'
},
xAxis : [ {
type : 'category',
boundaryGap : false,
data : []
} ],
yAxis : [ {
type : 'value',
axisLabel : {
formatter : '{value} %'
}
} ],
series : [ {
name : '用户在线率',
type : 'line',
data : []
}, {
name : '磁盘',
type : 'line',
data : []
}, {
name : '内存',
type : 'line',
data : []
} ]
}
} ]
});
// 指定图表的配置项和数据
activeChart.setOption({
title : {
text : '活跃用户TOP',
textStyle : {
color : '#333',
fontStyle : 'normal',
fontWeight : "600",
fontFamily : "microsoft yahei",
fontSize : 16
}
},
tooltip : {
trigger : 'axis',
axisPointer : { // 坐标轴指示器,坐标轴触发有效
type : 'none' // 默认为直线,可选为:'line' | 'shadow'
}
},
grid : {
left : '40px',
right : '40px',
bottom : '8%',
containLabel : true,
y2 : 140
},
xAxis : [ {
type : 'category',
data : [],
axisTick : {
alignWithLabel : true
},
//设置字体倾斜
axisLabel : {
rotate : -45,//倾斜度 -90 至 90 默认为0
interval : 0
},
} ],
yAxis : [ {
type : 'value'
} ],
series : [ {
name : '2017年',
type : 'bar',
barWidth : 30,//柱图宽度
itemStyle : {
normal : {
color : new echarts.graphic.LinearGradient(0, 0, 0, 1,
[ {
offset : 0,
color : '#fcc89f'
}, {
offset : 1,
color : '#fd7262'
} ])
},
emphasis : {
color : new echarts.graphic.LinearGradient(0, 0, 0, 1,
[ {
offset : 0,
color : '#fcc89f'
}, {
offset : 1,
color : '#fd7262'
} ])
}
},
data : []
//data: ${string}
} ]
});
function refreshOnTime(){
// 异步加载数据
$.ajax({
type : "get",
async : true, //异步请求
url : "${ctx}/index/index/selectmainchart", //请求发送到
data : {},
dataType : "json", //返回数据形式为json
success : function(data) {
//请求成功时执行该函数内容,result即为服务器返回的json对象
if (data) {
resourceChart.setOption({ //加载数据图表
xAxis : {
data : data.name
},
series : [ {
// 根据名字对应到相应的系列
name : '用户在线率',
data : data.countUser
}, {
// 根据名字对应到相应的系列
name : '磁盘',
data : data.countDisk
}, {
// 根据名字对应到相应的系列
name : '内存',
data : data.countMemory
}, ]
});
}
},
error : function(errorMsg) {
//请求失败时执行该函数
console.log("图表请求数据失败!");
}
})
// 异步加载数据
$.ajax({
type : "get",
async : true, //异步请求
url : "${ctx}/index/index/selecttop", //请求发送到
data : {},
dataType : "json", //返回数据形式为json
success : function(data) {
//请求成功时执行该函数内容,result即为服务器返回的json对象
if (data) {
activeChart.setOption({ //加载数据图表
xAxis : {
data : data.name
},
series : [ {
// 根据名字对应到相应的系列
name : '最近7天内',
data : data.count
} ]
});
}
},
error : function(errorMsg) {
//请求失败时执行该函数
console.log("图表请求数据失败!");
}
})
};
/*窗口自适应,关键代码*/
setTimeout(function() {
window.onresize = function() {
resourceChart.resize();
activeChart.resize();
}
}, 200)
</script>1.echarts的使用方式
准备一个具备大小(宽高)的 DOM div 中的id--- mainchart
<div id="mainchart" style="width: 100%;height:360px;"></div>通过 echarts.init 方法初始化一个 echarts 实例
var resourceChart = echarts.init(document.getElementById('mainchart'));并通过 setOption 方法生成一个简单的图表
option = {}
resourceChart.setOption(option);
2.主题的使用方式
使用 echarts.init(dom, 'customed') 创建图表,第二个参数即为 主题.js 文件中注册的主题名字
var resourceChart = echarts.init(document.getElementById('mainchart'),'macarons');注册主题名 echarts.registerTheme('macarons', {})
3.多图表窗口自适应
baseOption: {
},
madia:{
query:{},//jquery madia规则 maxWidth: 435
option:{}
}
4.图表移动端适配
function mainchart(){
// 基于准备好的dom,初始化echarts实例
var resourceChart = echarts.init(document.getElementById('mainchart'),'macarons');
var activeChart = echarts.init(document.getElementById('active'),'macarons');
// 指定图表的配置项和数据
option = {};
option2 = {};
// 使用刚指定的配置项和数据显示图表。
resourceChart.setOption(option);
activeChart.setOption(option2);
/*窗口自适应,关键代码*/
setTimeout(function (){
window.onresize = function () {
resourceChart.resize();
activeChart.resize();
}
},200)
};
5.图表title样式
title: {
text: '用户在线率/资源占用率',
textStyle:{
color:'#333',
fontStyle:'normal',
fontWeight:"600",
fontFamily:"microsoft yahei",
fontSize:16
}
},
6.坐标轴百分比显示
yAxis: [
{
type : 'value',
axisLabel: {
formatter: '{value} %'
}
}
],
7.悬浮框格式化,显示百分比
tooltip中的formatter弹出层的格式化
tooltip : {
trigger: 'axis',
axisPointer : { // 坐标轴指示器,坐标轴触发有效
type : 'line' // 默认为直线,可选为:'line' | 'shadow'
},
formatter: function(params,ticket,callback) {
var res = params[0].name;
res += '<br/>' + params[0].seriesName + ' : ' + params[0].value + '%';
if(params[1] != ''){
res += '<br/>' + params[1].seriesName + ' : ' + params[1].value+ '%';
}
if(params[2] != ''){
res += '<br/>' + params[2].seriesName + ' : ' + params[2].value+ '%';
}
setTimeout(function(){
callback(ticket, res);
}, 1)
return res;
}
},
第一个参数 params 是 formatter 需要的数据集。
componentType: 'series',
// 系列类型
seriesType: string,
// 系列在传入的 option.series 中的 index
seriesIndex: number,
// 系列名称
seriesName: string,
// 数据名,类目名 每条线所代表的名字
name: string,
// 数据在传入的 data 数组中的 index x轴上的名字
dataIndex: number,
// 传入的原始数据项
data: Object,
// 传入的数据值
value: number|Array,
// 数据图形的值
ticket 是异步回调标识,配合第三个参数 callback 使用。 第三个参数 callback 是异步回调
8.横坐标轴倾斜
xAxis : [
{
type : 'category',
data : ['李雪','周成龙','张敏','元芳菲','李菲儿','陈洁','张敏','元芳菲','李菲儿','陈洁'],
axisTick: {
alignWithLabel: true //刻度和标签对齐
},
//设置字体倾斜
axisLabel:{
rotate: -45,//倾斜度 -90 至 90 默认为0
interval: 0
},
}
],
9.柱状图固定宽度
series: [
{
name: '2017年',
type: 'bar',
barWidth : 30,//柱图宽度、
data[],
}
10.纵坐标轴颜色渐变
series-bar.itemStyle
图形样式,有 normal 和 emphasis 两个状态。normal 是图形在默认状态下的样式;emphasis 是图形在高亮状态下的样式,比如在鼠标悬浮或者图例联动高亮时。
series: [
{
name: '2017年',
type: 'bar',
barWidth : 30,//柱图宽度
itemStyle: {
normal: {
color: new echarts.graphic.LinearGradient(
0, 0, 0, 1,
[
{offset: 0, color: '#fcc89f'},
{offset: 1, color: '#fd7262'}
]
)
},
emphasis: {
color: new echarts.graphic.LinearGradient(
0, 0, 0, 1,
[
{offset: 0, color: '#fcc89f'},
{offset: 1, color: '#fd7262'}
]
)
}
},
data: [131594, 124141, 121594, 114141, 81807, 71007, 51000, 35002, 18200, 3000]
}
]
var resourceChart = echarts.init(document.getElementById('mainchart'));
var resourceChart = echarts.init(document.getElementById('mainchart'));11.追记折线图优化
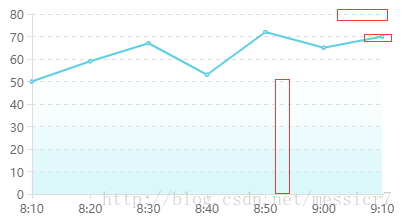
代码:
Option: {
                title: {
                    textStyle:{
                        color:'#333',
                        fontStyle:'normal',
                        fontWeight:"600",
                        fontFamily:"microsoft yahei",
                        fontSize:16
                    }
                },
                tooltip: {
                    trigger: 'axis',
                    axisPointer : {            // 坐标轴指示器,坐标轴触发有效
                        type : 'line'        // 默认为直线,可选为:'line' | 'shadow'
                    }
                },
                xAxis: [
                    {
                        type: 'category',
                        boundaryGap: false,
                        data: ['8:10','8:20','8:30','8:40','8:50','9:00','9:10'],
                        //轴线
                        axisLine:{
                            lineStyle:{
                                color:'#dddddd'
                            }
                        },
                        //轴刻度
                        axisTick:{
                            lineStyle:{
                                color:'#dddddd'
                            }
                        },
                        //轴字
                        axisLabel:{
                            color:'#696969'
                        }
                    }
                ],
                yAxis: [
                    {
                        type : 'value',
                        axisLabel: {
                            formatter: '{value} %'
                        },
                        //轴线
                        axisLine:{
                            lineStyle:{
                                color:'#dddddd'
                            }
                        },
                        //轴刻度
                        axisTick:{
                            lineStyle:{
                                color:'#dddddd'
                            }
                        },
                        //轴字
                        axisLabel:{
                            color:'#696969'
                        },
                        //网格
                        splitArea : {
                            show : true,
                            areaStyle : {
                                color: ['rgba(218,248,250,1)','rgba(218,248,250,0.8)','rgba(218,248,250,0.5)','rgba(218,248,250,0.2)','rgba(218,248,250,0.1)','rgba(218,248,250,0.0)','rgba(218,248,250,0)','rgba(218,248,250,0)','rgba(218,248,250,0)','rgba(218,248,250,0)','rgba(218,248,250,0)']
                            }
                        },
                        //网格线
                        splitLine : {
                            show : true,
                            lineStyle : {
                                width : 1,
                                color : '#dddddd',
                                type :'dashed'
                            }
                        }
                    }
                ],
                series: [
                    {
                        name:'用户在线率1',
                        type:'line',
                        data:[50, 59, 67, 53, 72, 65, 70]
                    }
                ]

            },