使用Minibatch的方式进行梯度下降
作业要求
作业正文
1、pathon实现Minibatch方式的梯度下降
代码
import numpy as np
import matplotlib.pyplot as plt
from pathlib import Path

x_data_name = "TemperatureControlXData.dat"
y_data_name = "TemperatureControlYData.dat"

class CData(object):
    def __init__(self, loss, w, b, epoch, iteration):
        self.loss = loss
        self.w = w
        self.b = b
        self.epoch = epoch
        self.iteration = iteration

def ReadData():
    Xfile = Path(x_data_name)
    Yfile = Path(y_data_name)
    if Xfile.exists() & Yfile.exists():
        X = np.load(Xfile)
        Y = np.load(Yfile)
        return X.reshape(1,-1),Y.reshape(1,-1)
    else:
        return None,None

def ForwardCalculationBatch(W,B,batch_x):
    Z = np.dot(W, batch_x) + B
    return Z

def BackPropagationBatch(batch_x, batch_y, batch_z):
    m = batch_x.shape[1]
    dZ = batch_z - batch_y
    dB = dZ.sum(axis=1, keepdims=True)/m
    dW = np.dot(dZ, batch_x.T)/m
    return dW, dB

def UpdateWeights(w, b, dW, dB, eta):
    w = w - eta*dW
    b = b - eta*dB
    return w,b

def CheckLoss(W, B, X, Y):
    m = X.shape[1]
    Z = np.dot(W, X) + B
    LOSS = (Z - Y)**2
    loss = LOSS.sum()/m/2
    return loss

def GetBatchSamples(X,Y,batch_size,iteration):
    M = np.linspace(0,X.shape[1]-1,X.shape[1])
    K = np.random.choice(M,batch_size,replace=False)
    batch_x = []
    batch_y = []
    for i in range(batch_size):
        L = int(K[i])
        batch_x.append(X[:,L][0])
        batch_y.append(Y[:,L][0])
        np.delete(X ,L ,1)
        np.delete(Y ,L ,1)
    batch_x = np.array([batch_x])
    batch_y = np.array([batch_y])
    batch_x.reshape(1,batch_size)
    batch_y.reshape(1,batch_size)
    return batch_x, batch_y, X, Y

def ShowLossHistory(dict_loss):
    loss = []
    for key in dict_loss:
        loss.append(key)

    #plt.plot(loss)
    plt.plot(loss[30:800])
    plt.xlabel("epoch")
    plt.ylabel("loss")
    plt.show()


if __name__ == '__main__':

    eta=0.1
    max_epoch=50
    batch_size=10

    W = np.zeros((1, 1))
    B = np.zeros((1, 1))

    loss = 5
    dict_loss = {}

    X, Y = ReadData()

    num_example = X.shape[1]
    num_feature = X.shape[0]

    max_iteration = (int)(num_example / batch_size)
    for epoch in range(max_epoch):
        check_X = X
        check_Y = Y
        for iteration in range(max_iteration):
            batch_x, batch_y ,check_X ,check_Y= GetBatchSamples(check_X,check_Y,batch_size,iteration)
            batch_z = ForwardCalculationBatch(W, B, batch_x)
            dW, dB = BackPropagationBatch(batch_x, batch_y, batch_z)
            W, B = UpdateWeights(W, B, dW, dB, eta)
            loss = CheckLoss(W,B,X,Y)
            prev_loss = loss
            dict_loss[loss] = CData(loss, W, B, epoch, iteration)
    ShowLossHistory(dict_loss)
输出结果
batch_size=5
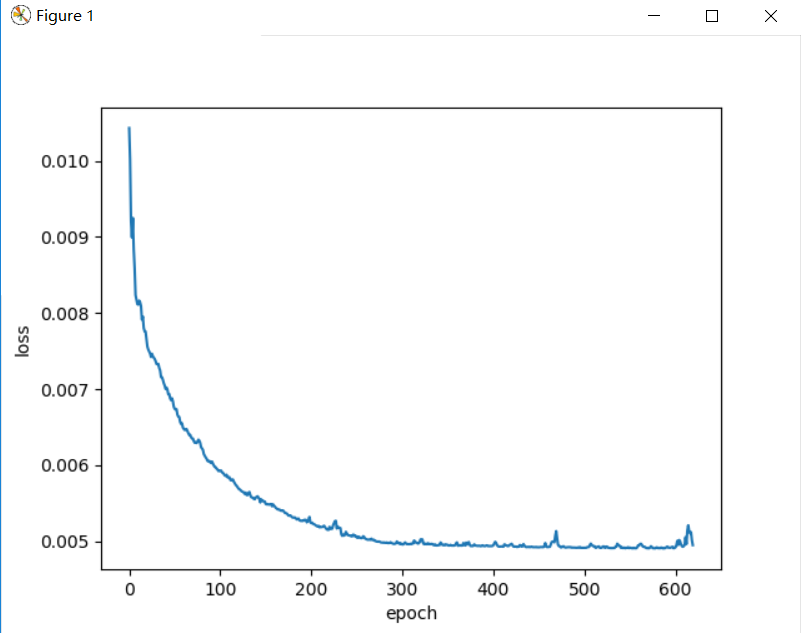
batch_size=10
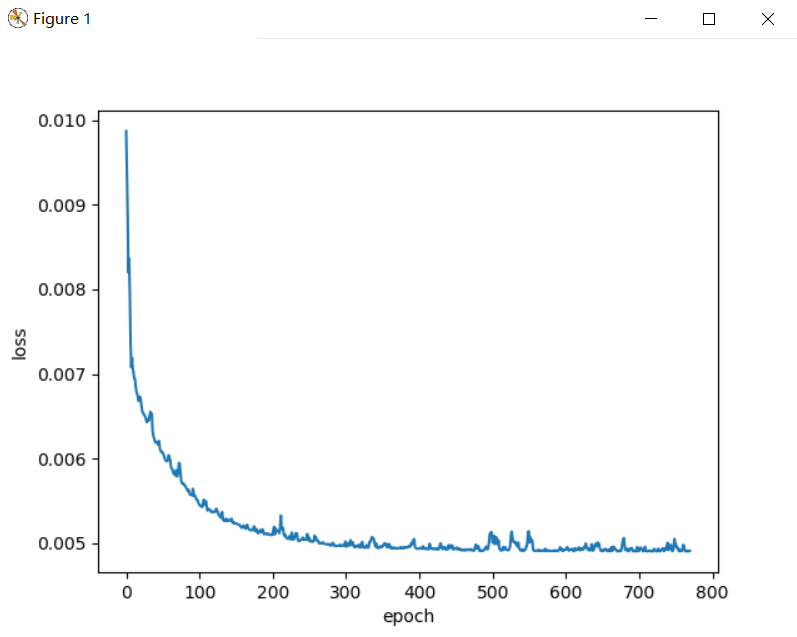
batch_size=15

2、关于损失函数的2D示意图的问题
- 1、为什么是椭圆而不是圆?如何把这个图变成一个圆?
    - 因为两个权重对函数的影响不一致,只要将影响一致或只采用一个权重,就可以将图变为圆。
- 2、为什么中心是个椭圆区域而不是一个点?
    - 因为散点分布的形式是一个区域。