1、定义绘图函数
import numpy as np
import matplotlib.pyplot as plt

def plot_square(center=(3, 3),length=5, width=2): x_left = center[0] - length/2 x_right = center[0] + length/2 y_upper = center[1] - width/2 y_lower = center[1] + width/2 x1 = np.array(x_left).repeat(50) y1 = np.linspace(y_lower, y_upper) x2 = np.linspace(x_left, x_right) y2 = np.array(y_upper).repeat(50) x3 = np.array(x_right).repeat(50) y3 = np.linspace(y_lower, y_upper) x4 = np.linspace(x_left, x_right) y4 = np.array(y_lower).repeat(50) for x, y in zip([x1, x2, x3, x4], [y1, y2, y3, y4]): plt.plot(x, y, c='k') plt.show()
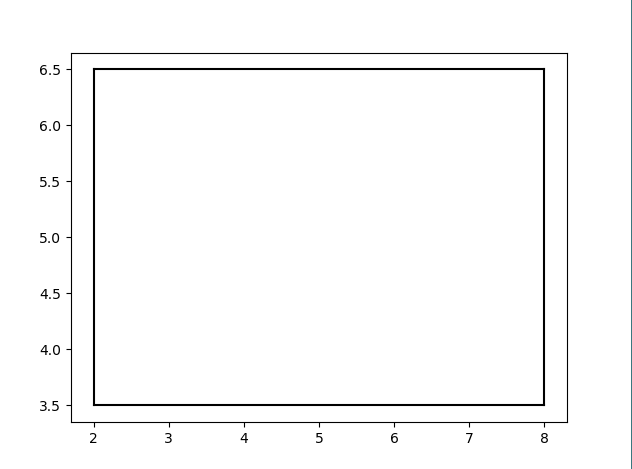
2、调用函数绘图
plot_square(center=(5, 5), lenght=6, width=3)
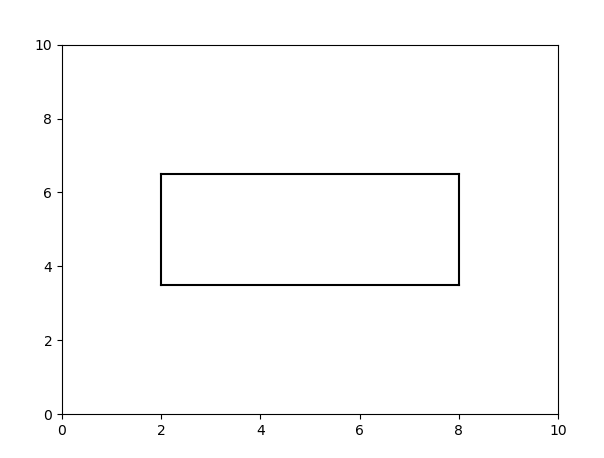
调整坐标轴,重新绘图
import matplotlib.pyplot as plt
plt.xlim(0, 10)
plt.ylim(0, 10)
plot_square((5, 5),length=6, width=3)
按语:
修改绘图函数,还可以设置边框颜色和填充。
1、定义绘图函数
import numpy as np
import matplotlib.pyplot as plt

def plot_square(center=(3, 3),length=5, width=2): x_left = center[0] - length/2 x_right = center[0] + length/2 y_upper = center[1] - width/2 y_lower = center[1] + width/2 x1 = np.array(x_left).repeat(50) y1 = np.linspace(y_lower, y_upper) x2 = np.linspace(x_left, x_right) y2 = np.array(y_upper).repeat(50) x3 = np.array(x_right).repeat(50) y3 = np.linspace(y_lower, y_upper) x4 = np.linspace(x_left, x_right) y4 = np.array(y_lower).repeat(50) for x, y in zip([x1, x2, x3, x4], [y1, y2, y3, y4]): plt.plot(x, y, c='k') plt.show()
2、调用函数绘图
plot_square(center=(5, 5), lenght=6, width=3)
调整坐标轴,重新绘图
import matplotlib.pyplot as plt
plt.xlim(0, 10)
plt.ylim(0, 10)
plot_square((5, 5),length=6, width=3)
按语:
修改绘图函数,还可以设置边框颜色和填充。