背景:众志成城抗疫情。今天是2020年2月1日,2019-nCov确诊人数一直在增长趋势。
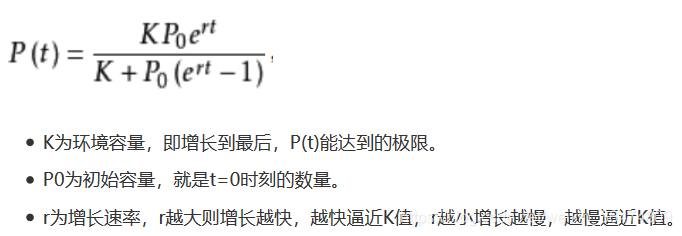
1.28日用logistic增长模型拟合了确认感染人数的数据。预测挺准,特别是r=0.55的时候,拟合方法及代码见:
python实现logistic增长模型拟合2019-nCov确诊人数
本文方法没有新内容,就是之前方法更新了数据再进行了拟合。但是模型依然没到拐点,疫情依然是扩散态势,形势严峻且复杂。最终确诊人数有可能突破两万。
目录
一、模型可靠性
1. logistic模型为不可靠模型
该模型初期可靠性高,中后期可靠性不高。原因如下:
- 传播初期疾病基本没有控制,但是中后期社区及医疗单位对疾病进行了严格控制,传播力度可能降低
- 感染基数较大,部分病例死亡或者痊愈,降低确诊人数,logistic模型没有考虑到。
- 试剂盒的检测周期和用于检测的试剂盒的量都在变化。
因此,logistic增长模型只是对疾病进行预估,并不能准确判断,也并不是最佳模型。最佳模型有SEIR模型等等,太专业,我也没时间研究。
2. 已有预测及结果及参数
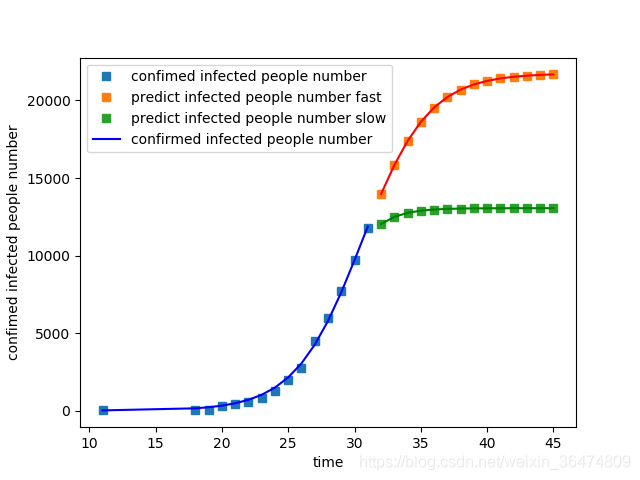
预测是比较准确的,预测1.28日几个r值均能较好拟合曲线。取0.55和0.65之间拟合较为准确。
比如,r取0.55的时候,24时累计确诊5976,实际确诊5974;预测1.29日24时确诊7533,实际确诊7711
3. r值区间
r值越大,模型越快收敛到K,r值越小,越慢收敛到K
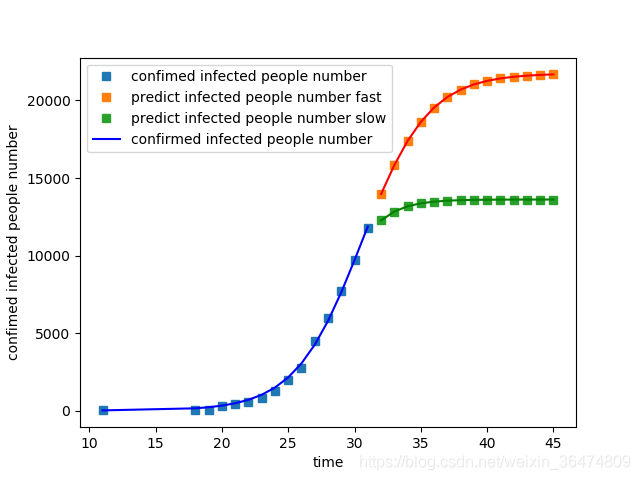
实际的R值在0.40(绿线)和0.64(红线)之间都有可能
二、下步预测
2.1 新增人数
目前情况比较严峻复杂,新增人数一直在上涨。
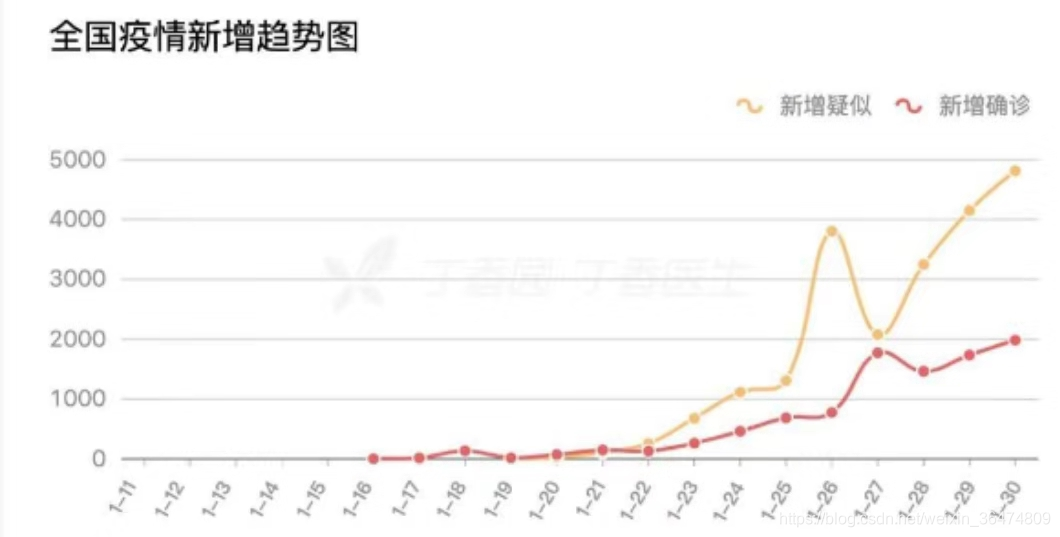
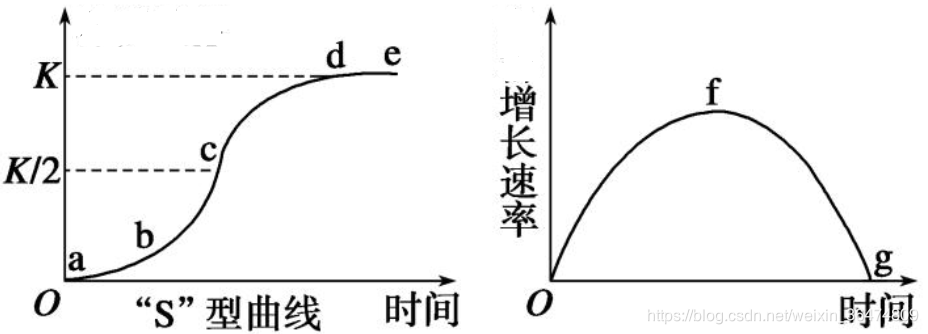
新增确诊就与下图增长速率对应,达到增长率右图最高点f的时候就是模型拐点,对应于左图的c点。但是目前趋势很难判断明天或者接下来增长速率趋势(二阶导数)是升还是降。
2.2 近几天趋势预测
新增人数的趋势一直在涨,至今没出现拐点,到底为什么?前期防控措施可能需要一定时间体现。
r取0.44和0.64之间,趋势图如下。预测2月1日24时累计在12030到13960之间
2月2日24时累计在12493到15829之间。
2.3 收敛点
乐观估计,随着预防政策的体现,感染人数会迅速到K,2月5号前就停止增长。
但是春运返程,可能导致进一步扩散,可能到2月10号,元宵节前。
目前模型拐点依然没有出现,很难判断下步到底什么态势。不同的r值均能跟之前的数据拟合较好,疫情还是在扩散阶段,情况严峻且复杂。
三、个人建议
- 做好打持久战准备。
- 别买双黄连,根本没有双盲实验,也没有临床试验。买点洗手液、酒精也比双黄连靠谱。
- 疾病传染性非常强,别出门。
四、代码
#!/usr/bin/python
# -*- coding: UTF-8 -*-
"""
拟合2019-nCov肺炎感染确诊人数
"""
import numpy as np
import matplotlib.pyplot as plt
import math
import pandas as pd

import numpy as np
import matplotlib.pyplot as plt
from scipy.optimize import curve_fit

def logistic_increase_function(t,K,P0,r):
    t0=11
    # t:time   t0:initial time    P0:initial_value    K:capacity  r:increase_rate
    exp_value=np.exp(r*(t-t0))
    return (K*exp_value*P0)/(K+(exp_value-1)*P0)

fast_r=0.40
slow_r=0.64

def faster_logistic_increase_function(t,K,P0,):
    return logistic_increase_function(t,K,P0,r=fast_r)

def slower_logistic_increase_function(t,K,P0,):
    return logistic_increase_function(t,K,P0,r=slow_r)

'''
1.11日41例
1.18日45例
1.19日62例
1.20日291例
1.21日440例
1.22日571例
1.23日830例
1.24日1287例
1.25日1975例
1.26日2744例
1.27日4515例
1.28日5976例
1.29日7711例
1.30日9692例
1.31日11791例
'''

#  日期及感染人数
#t=[11,18,19,20 ,21, 22, 23, 24,  25,  26,  27,  28,  29  ,30]
t=[11,18,19,20 ,21, 22,   23, 24,  25,  26,  27,  28,  29  ,30 ,  31]
t=np.array(t)
#P=[41,45,62,291,440,571,830,1287,1975,2744,4515,5974,7711,9692]
P=[41,45,62,291,440,571,  830,1287,1975,2744,4515,5974,7711,9692, 11791]
P=np.array(P)

# 用最小二乘法估计拟合
#popt, pcov = curve_fit(logistic_increase_function, t, P)
popt_fast, pcov_fast = curve_fit(faster_logistic_increase_function, t, P)
popt_slow, pcov_slow = curve_fit(slower_logistic_increase_function, t, P)
#获取popt里面是拟合系数
print("K:capacity  P0:initial_value   r:increase_rate   t:time")
#print(popt)
#拟合后预测的P值
#P_predict = logistic_increase_function(t,popt[0],popt[1],popt[2])
P_predict_fast= faster_logistic_increase_function(t,popt_fast[0],popt_fast[1])
P_predict_slow = slower_logistic_increase_function(t,popt_slow[0],popt_slow[1])
#未来长期预测
#future=[11,18,19,20 ,21, 22, 23, 24,  25,  26,  27,28,29,30,31,41,51,61,71,81,91,101]
#future=np.array(future)
#future_predict=logistic_increase_function(future,popt[0],popt[1],popt[2])
#近期情况预测
tomorrow=[32,33,34,35,36,37,38,39,40,41,42,43,44,45]
tomorrow=np.array(tomorrow)
#tomorrow_predict=logistic_increase_function(tomorrow,popt[0],popt[1],popt[2])
tomorrow_predict_fast=logistic_increase_function(tomorrow,popt_fast[0],popt_fast[1],r=fast_r)
tomorrow_predict_slow=logistic_increase_function(tomorrow,popt_slow[0],popt_slow[1],r=slow_r)

#绘图
plot1 = plt.plot(t, P, 's',label="confimed infected people number")
#plot2 = plt.plot(t, P_predict, 'r',label='predict infected people number')
#plot3 = plt.plot(tomorrow, tomorrow_predict, 's',label='predict infected people number')
plot2 = plt.plot(tomorrow, tomorrow_predict_fast, 's',label='predict infected people number fast')
plot3 = plt.plot(tomorrow, tomorrow_predict_fast, 'r')
plot4 = plt.plot(tomorrow, tomorrow_predict_slow, 's',label='predict infected people number slow')
plot5 = plt.plot(tomorrow, tomorrow_predict_slow, 'g')
plot6 = plt.plot(t, P_predict_fast, 'b',label='confirmed infected people number')

plt.xlabel('time')
plt.ylabel('confimed infected people number')

plt.legend(loc=0) #指定legend的位置右下角

print("32\n")
print(faster_logistic_increase_function(np.array(32),popt_fast[0],popt_fast[1]))
print(slower_logistic_increase_function(np.array(32),popt_slow[0],popt_slow[1]))

print("33\n")
print(faster_logistic_increase_function(np.array(33),popt_fast[0],popt_fast[1]))
print(slower_logistic_increase_function(np.array(33),popt_slow[0],popt_slow[1]))

plt.show()


print("Program done!")python实现logistic增长模型拟合2019-nCov确诊人数
Unet论文详解U-Net:Convolutional Networks for Biomedical Image Segmentation
眼底血管分割MICCAI 2019论文详解Multi-task Neural Networks with Spatial Activation for Retinal Vessel...
