泊松分布:
模型:假设单位时间内发生时间
次,求单位时间内事件发生x次的概率。
分布函数:
矩母函数:
似然函数:
性质:
用matplotlib验证这一性质:
import numpy as np
import matplotlib.pyplot as plt

plt.xlim(0,30)
plt.ylim(0.00,0.20)
sample1 = np.random.poisson(lam=5, size=10000)
sample2 = np.random.poisson(lam=10, size=10000)
sample3 = np.random.poisson(lam=15, size=10000)
pillar=30
s1=plt.hist(sample1,rwidth=0.9,alpha=0.6,density=True,label="x1",bins=pillar,range=[0,pillar])
plt.plot(s1[1][0:pillar],s1[0],'blue')
s2=plt.hist(sample2,rwidth=0.9,alpha=0.6,density=True,label="x2",bins=pillar,range=[0,pillar])
plt.plot(s2[1][0:pillar],s2[0],'orange')
s3=plt.hist(sample3,rwidth=0.9,alpha=0.6,density=True,label="x3",bins=pillar,range=[0,pillar])
plt.plot(s3[1][0:pillar],s3[0],'g')
s4=plt.hist(sample1+sample2,rwidth=0.9,alpha=0.6,density=True,label="x3=x1+x2",bins=pillar,range=[0,pillar])
plt.plot(s4[1][0:pillar],s4[0],'r')
plt.legend()
plt.show()

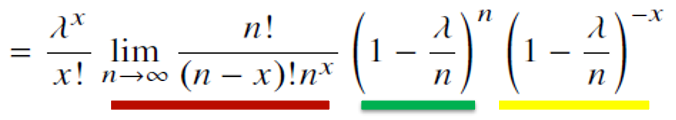
泊松分布与二项分布的关系:
二项分布:
二者关系:
证明:

import numpy as np
import matplotlib.pyplot as plt


def draw(n,p,lam):
    plt.title("n={}, p={}, $\lambda$={}".format(n,p,lam))
    b = np.random.binomial(n=n,p=p, size=1000)
    p = np.random.poisson(lam=lam, size=1000)
    pillar=50
    sb=plt.hist(b,rwidth=0.9,alpha=0.6,density=True,bins=pillar,range=[0,pillar],label="binomial")
    plt.plot(sb[1][0:pillar],sb[0],'blue')
    sp=plt.hist(p,rwidth=0.9,alpha=0.6,density=True,bins=pillar,range=[0,pillar],label="poisson")
    plt.plot(sp[1][0:pillar],sp[0],'orange')
    plt.legend()


plt.figure(figsize=(8,8),dpi=80)

plt.subplot(221)
draw(100,0.1,10)

plt.subplot(222)
draw(100,0.1,20)

plt.subplot(223)
draw(300,0.1,10)

plt.subplot(224)
draw(10,0.1,50)

plt.show()
(n×p越接近于
,拟合程度越好)

