全面的日志管理和分析策略对任务至关重要,这使组织能够了解运营,安全性和变更管理事件之间的关系,并保持对其基础架构的全面理解。 来自Web服务器,应用程序和操作系统的日志文件也提供了有价值的数据,尽管格式不同,并且以随机和分布式方式提供。
为什么Apache Web Server如此受欢迎? 它是免费和开放源代码,为全球约40%的网站提供支持。并且开放源代码正比专有软件更加流行。 由Apache Software Foundation维护和开发,提供安全性,非常适合小型和大型网站,可以在所有主要操作系统上轻松设置,并且功能极其强大且非常灵活。

在本文中,我们将引导您完成初始步骤,并向您展示启动和配置集群的过程非常简单。 然后,我们安装并配置logstash,以将我们的apache日志发送到elasticsearch。 然后可以通过Kibana仪表板可视化并分析运送到elasticsearch的Apache日志。
我们的目标
本教程的目标是将使用Elastic Stack用作Apache日志的集中式日志记录和监视解决方案。 我们将在单独的节点中设置Logstash,以从单个或多个服务器收集apache日志,并使用预配置的Kibana可视化所收集的日志。
我们的Elastic Stack设置包含三个主要组件:
- Elasticsearch:用于存储所有应用程序和监视日志
- Logstash:服务器组件,用于处理传入的日志并馈送给Elastic Stack
- Kibana:用于搜索和可视化日志的Web界面
配置

在上面的配置中,我们有两个操作系统:MacOS及Ubuntu OS。在它们的上面我们分别安装如上所示的Elastic Stack部分。针对你的安装,可能有不同的IP地址。需要在一下的安装中进行相应的修改。
我们将使用如下的方式来进行数据的采集:

我们把数据直接传入到Logstash中。我们使用Logstash对数据进行分析,丰富,然后再传入到Elasticsearch中。最后,我们使用Kibana来对数据进行分析及展示。
安装
Elasticsearch
我按照文档“如何在Linux,MacOS及Windows上进行安装Elasticsearch”安装Elasticsearch。但是为了能够让我的Elasticsearch能被其它的虚拟机中被访问,我对Elasticsearch的配置文件config/elasticsearch.yml做了如下的配置:
cluster.name: elasticsearch
node.name: node1
network.host: _site_
cluster.initial_master_nodes: ["node1"]在上面,我们命名cluster.name为elasticsearch,并给予这个node的名字为node1。如果大家对上面的network.host被定义为_site_不太理解的话,可以参阅文档。它的意思就是把elasticsearch的9200绑定于所有的网络接口。修改完上面的elasticsearch.yml文件后,我们重新启动Elasticsearch,我们可以看到:

上面显示9200端口已经成功地绑定于目前所有的网络的地址上了。我们可以通过如下的命令来查看我们的网路接口:
ifconfig我们可以通过如下的命令来检查IP地址:
ifconfig eth0 | grep inet | awk '{ print $2 }'在上面的命令中,我们需要根据自己的网络的接口来替换上面的eth0。
我们可以分别在我们的浏览器中输入上面的9200端口的地址。如果你能看到输出,则表明我们的安装时正确的。

Kibana
我们根据文章“如何在Linux,MacOS及Windows上安装Elastic栈中的Kibana”来安装Kibana。为了能够访问我们上面安装的Elasticsearch,我们需要在默认的Kibana中做相应的调整。我们来修改config/kibana.yml文件:
server.host: "192.168.43.220"
elasticsearch.hosts: ["http://192.168.43.220:9200"]
请用自己环境里的host的名字来做替换,同时也需要根据自己的Elasticsearch的IP地址来进行相应的修改。等我们修改完后,我们来重新启动我们的Kibana。在我们的浏览器中,我们输入相应的IP:5601来查看安装是否正确:

如果能看到上面的输出,则表明我们的Kibana安装已经正确。
Apache
在今天的web server设计中,我们将使用Nodejs + Apache的组合。你可以根据自己喜欢的方式选用自己喜欢的语言来设计自己的web:

我们来安装nodejs及apache。
sudo apt-get update
sudo apt-get install apache2 nodejs
接下来,我们需要将通过node.js应用程序的URL在端口80上传入的所有请求代理到正在运行的本地node.js进程。 为此,我们需要在Apache服务器上安装/启用mod_proxy和mod_proxy_http模块:
a2enmod proxy
a2enmod proxy_http
因此,现在令人兴奋的部分开始了。 我们需要配置Apache服务器以代理对node.js应用程序的请求。 然后,我们将为此配置一个VirtualHost。我们首先进入目录/etc/apache2/sites-available
$ pwd
/etc/apache2/sites-available
liuxg@liuxg:/etc/apache2/sites-available$ ls
000-default.conf  default-ssl.conf
我首先来创建一个属于我们自己的conf文件。针对我的情况,我创建一个叫做liuxg.conf为文件,它的内容如下:
liuxg.conf
<VirtualHost *:80>
	# The ServerName directive sets the request scheme, hostname and port that
	# the server uses to identify itself. This is used when creating
	# redirection URLs. In the context of virtual hosts, the ServerName
	# specifies what hostname must appear in the request's Host: header to
	# match this virtual host. For the default virtual host (this file) this
	# value is not decisive as it is used as a last resort host regardless.
	# However, you must set it for any further virtual host explicitly.
	ServerName www.liuxg.com
        ServerAlias www.liuxg.com

        ProxyRequests Off
        ProxyPreserveHost On
        ProxyVia Full
        <Proxy *>
          Require all granted
        </Proxy>

        ProxyPass / http://127.0.0.1:3000/
        ProxyPassReverse / http://127.0.0.1:3000/

	# Available loglevels: trace8, ..., trace1, debug, info, notice, warn,
	# error, crit, alert, emerg.
	# It is also possible to configure the loglevel for particular
	# modules, e.g.
	#LogLevel info ssl:warn

	ErrorLog ${APACHE_LOG_DIR}/error.log
	CustomLog ${APACHE_LOG_DIR}/access.log combined

	# For most configuration files from conf-available/, which are
	# enabled or disabled at a global level, it is possible to
	# include a line for only one particular virtual host. For example the
	# following line enables the CGI configuration for this host only
	# after it has been globally disabled with "a2disconf".
	#Include conf-available/serve-cgi-bin.conf
</VirtualHost>

# vim: syntax=apache ts=4 sw=4 sts=4 sr noet
在上面,我们配置了如下的设置:
        ProxyPass / http://127.0.0.1:3000/
        ProxyPassReverse / http://127.0.0.1:3000/
请注意我们在VirtualHost里定义的80口。通过上面的配置,我们可以把来自127.0.0.1:80的请求都映射到127.0.0.1:3000。我在上面定义了ServerName定义为 www.liuxg.com。如果我们还没有自己的域名,我们可以在/etc/hosts里定义这个域名的解析:
liuxg@liuxg:/etc$ pwd
/etc
liuxg@liuxg:/etc$ cat hosts
127.0.0.1	localhost
127.0.1.1	liuxg
192.168.43.192  test.com
127.0.0.1       liuxg.com

# The following lines are desirable for IPv6 capable hosts
::1     ip6-localhost ip6-loopback
fe00::0 ip6-localnet
ff00::0 ip6-mcastprefix
ff02::1 ip6-allnodes
ff02::2 ip6-allrouters
接下来,我们必须启用此新站点配置,并禁用默认站点配置。
sudo a2ensite liuxg.conf
sudo a2dissite 000-default.conf
在修改完我们上面配置后,我们需要重新启动apache的服务:
sudo service apache2 restart我们可以通过如下命令来检查apache是否已经正常运行:
systemctl status apache2$ systemctl status apache2
● apache2.service - The Apache HTTP Server
Loaded: loaded (/lib/systemd/system/apache2.service; enabled; vendor preset: enabled)
Drop-In: /lib/systemd/system/apache2.service.d
└─apache2-systemd.conf
Active: active (running) since Sun 2020-03-22 10:17:05 CST; 7s ago
Process: 5683 ExecStart=/usr/sbin/apachectl start (code=exited, status=0/SUCCESS)
Main PID: 5687 (apache2)
Tasks: 55 (limit: 4915)
CGroup: /system.slice/apache2.service
├─5687 /usr/sbin/apache2 -k start
├─5688 /usr/sbin/apache2 -k start
└─5689 /usr/sbin/apache2 -k start如果你看到上面的状态为active,则表明apache服务正在运行。我们也可以在浏览器地址栏中输入localhost:80来检查一下apache是否正常工作。
接下来,我们来用一个nodejs的项目做测试。首先我们下载如下的项目:
git clone https://github.com/contentful/the-example-app.nodejs等下载上面的项目过后,我们进行到项目的根目录中:
$ pwd
/home/liuxg/nodejs/the-example-app.nodejs
liuxg@liuxg:~/nodejs/the-example-app.nodejs$ ls
app.js    cypress.json  helpers.js  LICENSE        package.json       README.md  test
app.json  Dockerfile    i18n        node_modules   package-lock.json  routes     variables.env
bin       handlers      lib         npm-debug.log  public             services   views
打入如下的命令:
npm install等安装完后,接着打入如下的命令来进行运行:
npm run start:dev这样在我们的Ubuntu OS里的浏览器中,我们可以检测Web服务器是否正常运行:

上面显示3000口地址已经运行正常。我们检查一下80口地址:

在上面,我们可以看到localhost在默认的情况下使用的是80口地址,它表明我们的apachec已经成功被运动成功。如果你已经在/etc/hosts已经进行过域名的设置后,那么:

我们可以在如下的地址找到apache的log文件:
$ pwd
/var/log/apache2
liuxg@liuxg:/var/log/apache2$ ls
access.log  access.log.1  error.log  error.log.1  other_vhosts_access.log
在上面我们可以看到access.log,error.log等文件。access.log的内容如下:

安装Logstash
我们在Ubuntu OS上安装Logstash。
Logstash是一个开源工具,可以收集,解析和存储日志以备将来使用,并可以进行快速日志分析。 Logstash可用于聚合来自多个来源(如Docker实例集群)的日志,并将其从文本行解析为JSON之类的结构化格式。 在Elastic Stack中,Logstash使Elasticsearch来存储和索引日志。
Logstash需要安装Java 8或Java 11:
sudo apt-get install default-jre验证是否已安装Java:
java -version如果上一个命令的输出与下面的相似,那么您将知道自己朝着正确的方向前进:
openjdk version "11.0.6" 2020-01-14
OpenJDK Runtime Environment (build 11.0.6+10-post-Ubuntu-1ubuntu118.04.1)
OpenJDK 64-Bit Server VM (build 11.0.6+10-post-Ubuntu-1ubuntu118.04.1, mixed mode, sharing)
使用以下命令安装Logstash:
curl -L -O https://artifacts.elastic.co/downloads/logstash/logstash-7.6.1.deb
sudo dpkg -i logstash-7.6.1.deb
上面我们安装的是和我们的Elasticsearch相匹配的7.6.1版本。你可以根据自己的版本修改上面的版本来进行下载。
至此我们的安装已经全部完成。
配置Logstash
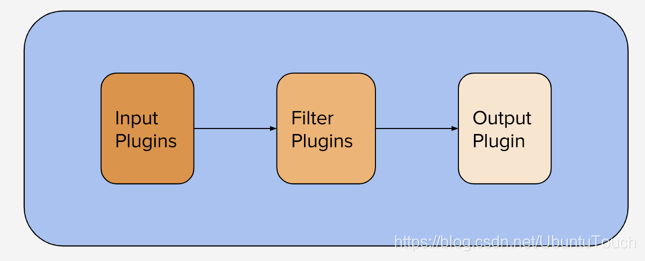
Logstash配置文件采用JSON格式,位于/etc/logstash/conf.d中。 该配置包括三个部分:输入,过滤器和输出。
让我们创建一个名为02-apache-input.conf的配置文件,并设置我们的apache输入:
sudo vi /etc/logstash/conf.d/02-apache-input.conf插入以下输入配置:
input {
 file {
   path => ["/var/log/apache2/access.log"]
   start_position => "beginning"
   sincedb_path => "/dev/null"
   type => "apache_access"
 }
 file {
   path => ["/var/log/apache2/error.log"]
   start_position => "beginning"
   sincedb_path => "/dev/null"
   type => "apache_error"
 }
}
注意:Apache日志文件路径可能会根据您的环境和基础操作系统而有所不同。
保存并退出。 这指定了一个将在tcp端口5044上侦听的apache输入。现在,我们创建一个名为10-apache-filter.conf的配置文件,在其中我们将为apache消息添加一个过滤器:
sudo vi /etc/logstash/conf.d/10-apache-filter.conf插入以下apache过滤器配置:
filter {
   if [type] in [ "apache" , "apache_access" , "apache-access" ]  {
      grok {
         match => [
         "message" , "%{COMBINEDAPACHELOG}+%{GREEDYDATA:extra_fields}",
         "message" , "%{COMMONAPACHELOG}+%{GREEDYDATA:extra_fields}"
         ]
         overwrite => [ "message" ]
      }
      mutate {
         convert => ["response", "integer"]
         convert => ["bytes", "integer"]
         convert => ["responsetime", "float"]
      }
      geoip {
         source => "clientip"
         target => "geoip"
         add_tag => [ "apache-geoip" ]
      }
      date {
         match => [ "timestamp" , "dd/MMM/YYYY:HH:mm:ss Z" ]
         remove_field => [ "timestamp" ]
      }
      useragent {
         source => "agent"
      }
   }
   if [type] in ["apache_error","apache-error"] {
      grok {
         match => ["message", "\[%{WORD:dayname} %{WORD:month} %{DATA:day} %{DATA:hour}:%{DATA:minute}:%{DATA:second} %{YEAR:year}\] \[%{NOTSPACE:loglevel}\] (?:\[client %{IPORHOST:clientip}\] ){0,1}%{GREEDYDATA:message}"]
         overwrite => [ "message" ]
      }
      mutate
      {
         add_field =>
         {
            "time_stamp" => "%{day}/%{month}/%{year}:%{hour}:%{minute}:%{second}"
         }
      }
      date {
         match => ["time_stamp", "dd/MMM/YYYY:HH:mm:ss"]
         remove_field => [ "time_stamp","day","dayname","month","hour","minute","second","year"]
      }
   }
}
保存并退出。 该过滤器查找标记为“apache”类型的日志,它将尝试使用grok解析传入的apache日志以使其结构化和可查询。
最后,我们将创建一个名为30-elasticsearch-output.conf的配置文件:
sudo vi /etc/logstash/conf.d/30-elasticsearch-output.conf插入以下输出配置:
output {
 elasticsearch {
   hosts => ["http://192.168.43.220:9200"]
   user => "YourUserName"
   password => "YourPassword"
   index => "apache-%{+YYYY.MM.dd}"
 }
 stdout { codec => rubydebug }
}
如果你在Elasticseearch中已经配置了安全,那么请在上面填入自己的user及password。否则的话,可以不用管。
保存并退出。 此输出基本上将Logstash配置为将日志数据存储在http://192.168.43.220:9200运行的Elasticsearch中。它的索引的名字为apache_logs。
等我们配资完后,我们可以使用如下的命令来检查我们的配置是否成功:
/usr/share/logstash/bin/logstash --configtest -f /etc/logstash/conf.d/ 我们也可以仿照我的另外一篇文章“如何安装Elastic栈中的Logstash”来安装Logstash。通过解压logstash安装包来进行安装,并把所有的inputs, filters及outputs只要同一个配置文件中,比如logstash.conf:
logstash.conf
input {
  file {
    path => ["/var/log/apache2/access.log"]
    start_position => "beginning"
    sincedb_path => "/dev/null"
    type => "apache_access"
  }
  file {
    path => ["/var/log/apache2/error.log"]
    start_position => "beginning"
    sincedb_path => "/dev/null"
    type => "apache_error"
  }
}
filter {
   if [type] in [ "apache" , "apache_access" , "apache-access" ]  {
      grok {
         match => [
         "message" , "%{COMBINEDAPACHELOG}+%{GREEDYDATA:extra_fields}",
         "message" , "%{COMMONAPACHELOG}+%{GREEDYDATA:extra_fields}"
         ]
         overwrite => [ "message" ]
      }
      mutate {
         convert => ["response", "integer"]
         convert => ["bytes", "integer"]
         convert => ["responsetime", "float"]
      }
      geoip {
         source => "clientip"
         target => "geoip"
         add_tag => [ "apache-geoip" ]
      }
      date {
         match => [ "timestamp" , "dd/MMM/YYYY:HH:mm:ss Z" ]
         remove_field => [ "timestamp" ]
      }
      useragent {
         source => "agent"
      }
   }
   if [type] in ["apache_error","apache-error"] {
      grok {
         match => ["message", "\[%{WORD:dayname} %{WORD:month} %{DATA:day} %{DATA:hour}:%{DATA:minute}:%{DATA:second} %{YEAR:year}\] \[%{NOTSPACE:loglevel}\] (?:\[client %{IPORHOST:clientip}\] ){0,1}%{GREEDYDATA:message}"]
         overwrite => [ "message" ]
      }
      mutate
      {
         add_field =>
         {
            "time_stamp" => "%{day}/%{month}/%{year}:%{hour}:%{minute}:%{second}"
         }
      }
      date {
         match => ["time_stamp", "dd/MMM/YYYY:HH:mm:ss"]
         remove_field => [ "time_stamp","day","dayname","month","hour","minute","second","year"]
      }
   }
}
output {
 elasticsearch {
   hosts => ["http://192.168.43.220:9200"]
   user => "YourUserName"
   password => "YourPassword"
   index => "apache-%{+YYYY.MM.dd}"
 }
 stdout { codec => rubydebug }
}
启动Logstash
我们可以直接使用上面的logstash.conf来运行:
sudo /usr/share/logstash/bin/logstash -f logstash.conf我们在logstash.conf所在目录里运行上面的命令。在terminal中,我们可以看到如下的输出:

打开Kibana,并输入如下的命令:
GET _cat/indices
我们可以查看apache事件的数量:

在我们的nodejs的Web服务器中,点击几个链接,然后再查看一下事件的数量:

我们发现事件的数量在增加。我们也可以通过Kibana的Discover来发现apache的事件:

好了,今天的文章就先写到这里。希望对你有所帮助。
参考:
【2】https://www.cloudbooklet.com/setup-node-js-with-apache-proxy-on-ubuntu-18-04-for-production/
