在OpenDRIVE地图的解析和绘制过程中,最关键的一点:在x/y坐标系下,利用起点(x,y)、曲线的相对长度(s坐标,该点距离起点的线段长度)计算出相应长度处所对应的x/y坐标。目前使用较多的Geometry类型为直线line、arc、spiral。
1.直线line的解析最简单,知道起点(x,y),直线角度hdg,距离起点的线段长度s,既可以计算出相对起点的dx,dy。
dx = s * cos(hdg)
dy = s * sin(hdg)
2.对于arc,有一个恒定的参数曲率curvature,dx,dy计算方式如下,
 c = curvature
 hdg = heading - PI / 2

 a = 2 / c * sin(s * c / 2)
 alpha = (PI - s * c) / 2 - hdg

 dx = -1 * a * cos(alpha)
dy = a * sin(alpha)3.spiral最复杂,不过OpenDRIVE官网给出了一个计算的例子(Sample code for the calculation of spirals),关键代码如下(c语言),可以按照原理利用具体的编程语言实现,
/**
* compute the actual "standard" spiral, starting with curvature 0
* @param s      run-length along spiral
* @param cDot   first derivative of curvature [1/m2]
* @param x      resulting x-coordinate in spirals local co-ordinate system [m]
* @param y      resulting y-coordinate in spirals local co-ordinate system [m]
* @param t      tangent direction at s [rad]
*/

void odrSpiral( double s, double cDot, double *x, double *y, double *t )
{
    double a;

    a = 1.0 / sqrt( fabs( cDot ) );
    a *= sqrt( M_PI );

    fresnel( s / a, y, x );

    *x *= a;
    *y *= a;

    if ( cDot < 0.0 )
        *y *= -1.0;

    *t = s * s * cDot * 0.5;
}
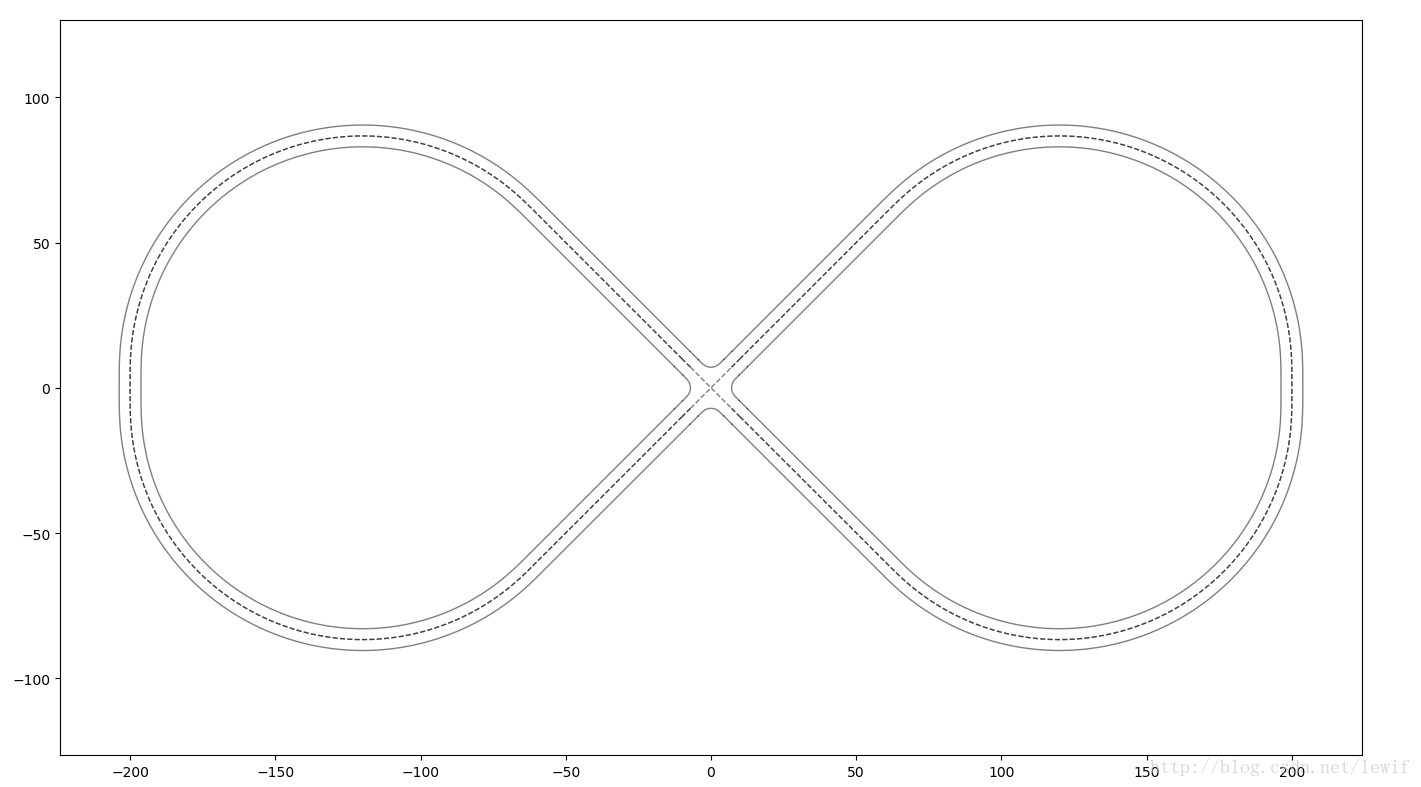
将地图中的所有线段都解析为x/y坐标后,我们很容易利用一些画图工具绘制出相应的地图,下图为利用python matplotlib绘制的地图,地图数据基于OpenDRIVE官网的Crossing8Course.xodr。只绘制了lane type为driving的车道线。
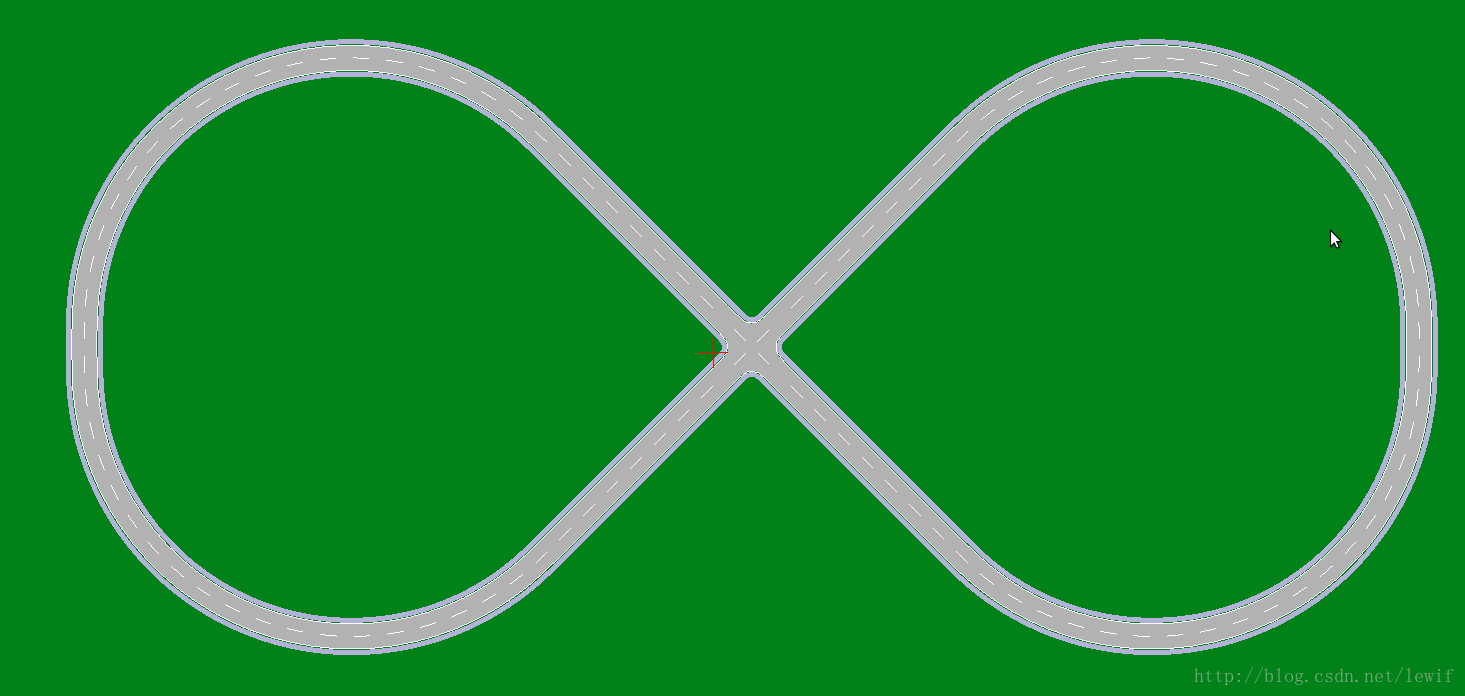
下图为官方工具OpenDRIVE Viewer绘制的地图(linux下运行,不开源)。