VS2017 CUDA编程学习1:CUDA编程两变量加法运算
VS2017 CUDA编程学习2:在GPU上执行线程
VS2017 CUDA编程学习3:CUDA获取设备上属性信息
VS2017 CUDA编程学习4:CUDA并行处理初探 - 向量加法实现
VS2017 CUDA编程学习5:CUDA并行执行-线程
VS2017 CUDA编程学习6: GPU存储器架构
VS2017 CUDA编程学习7:线程同步-共享内存
VS2017 CUDA编程学习8:线程同步-原子操作
VS2017 CUDA编程学习9:常量内存
VS2017 CUDA编程学习10:纹理内存
VS2017 CUDA编程学习实例1:CUDA实现向量点乘
前言
今天跟大家分享CUDA程序性能测量的方法:CUDA事件API和CUDA可视化性能分析工具-nvidia visual profiler
1. CUDA事件API
为什么要使用CUDA事件API而不是使用CPU时间统计的API来测量CUDA程序性能呢?这是因为CPU和GPU设备不是同步执行的,而是异步的,所以在CPU上使用时间统计的API来记录GPU的运行时间是不精确的。
CUDA事件,通俗地讲,就是GPU上记录时间戳的API,类似CPU上运行时间统计(e.g. clock_t, time_t, …);
使用CUDA事件主要包括3个步骤:1. 创建CUDA事件;2记录CUDA事件;3. 统计CUDA事件记录的时间;
2. C++ 实现CUDA事件例子
这里以在GPU上实现10000个数据的加法运算为例介绍CUDA事件的简单用法。
详细代码如下所示:
#include <stdio.h>
#include <cuda.h>
#include<cuda_runtime.h>
#include <cuda_runtime_api.h>
#include <device_launch_parameters.h>
#define N 10000
#define THREADS_PER_BLOCK 100
#define BLOCKS_PER_GRID 100
// define kernel function to add two variable
__global__ void gpuAdd(int* d_a, int* d_b, int* d_c)
{
int ttid = threadIdx.x + blockIdx.x * blockDim.x;
d_c[ttid] = d_a[ttid] + d_b[ttid];
}
int main()
{
int *h_a, *h_b, *h_c;
int *d_a, *d_b, *d_c;
h_a = (int*)malloc(N * sizeof(int));
h_b = (int*)malloc(N * sizeof(int));
h_c = (int*)malloc(N * sizeof(int));
for (int i = 0; i < N; i++)
{
h_a[i] = i;
h_b[i] = i;
}
//定义GPU事件变量
cudaEvent_t e_start, e_stop;
cudaEventCreate(&e_start);
cudaEventCreate(&e_stop);
//记录GPU开始时间, 第二个参数为0, 表示CUDA流
cudaEventRecord(e_start, 0);
//分配GPU设备内存
cudaMalloc(&d_a, N * sizeof(int));
cudaMalloc(&d_b, N * sizeof(int));
cudaMalloc(&d_c, N * sizeof(int));
//拷贝CPU内存数据到GPU内存中
cudaMemcpy(d_a, h_a, N * sizeof(int), cudaMemcpyHostToDevice);
cudaMemcpy(d_b, h_b, N * sizeof(int), cudaMemcpyHostToDevice);
//调用内核函数
gpuAdd << <BLOCKS_PER_GRID, THREADS_PER_BLOCK >> > (d_a, d_b, d_c);
//拷贝GPU内存数据到CPU内存中
cudaMemcpy(h_c, d_c, N * sizeof(int), cudaMemcpyDeviceToHost);
//等待GPU设备执行完成
cudaDeviceSynchronize();
//记录GPU运行结束时间
cudaEventRecord(e_stop, 0);
//等待GPU记录完成, cudaEventRecord调用后立马返回,不确定GPU是否执行完成,这里要等待
cudaEventSynchronize(e_stop);
float elapsedTime;
//计算GPU执行时间
cudaEventElapsedTime(&elapsedTime, e_start, e_stop);
//print result
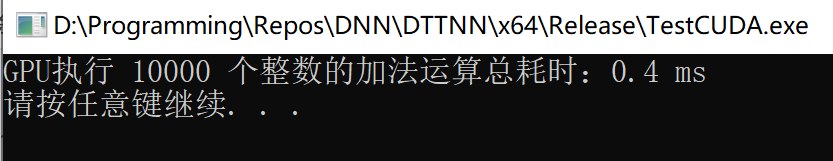
printf("GPU执行 %d 个整数的加法运算总耗时:%3.1f ms\n", N, elapsedTime);
//释放GPU设备内存
cudaFree(d_a);
cudaFree(d_b);
cudaFree(d_c);
//释放CPU内存
free(h_a);
free(h_b);
free(h_c);
system("pause");
return 0;
}
3. CUDA事件例子的执行结果
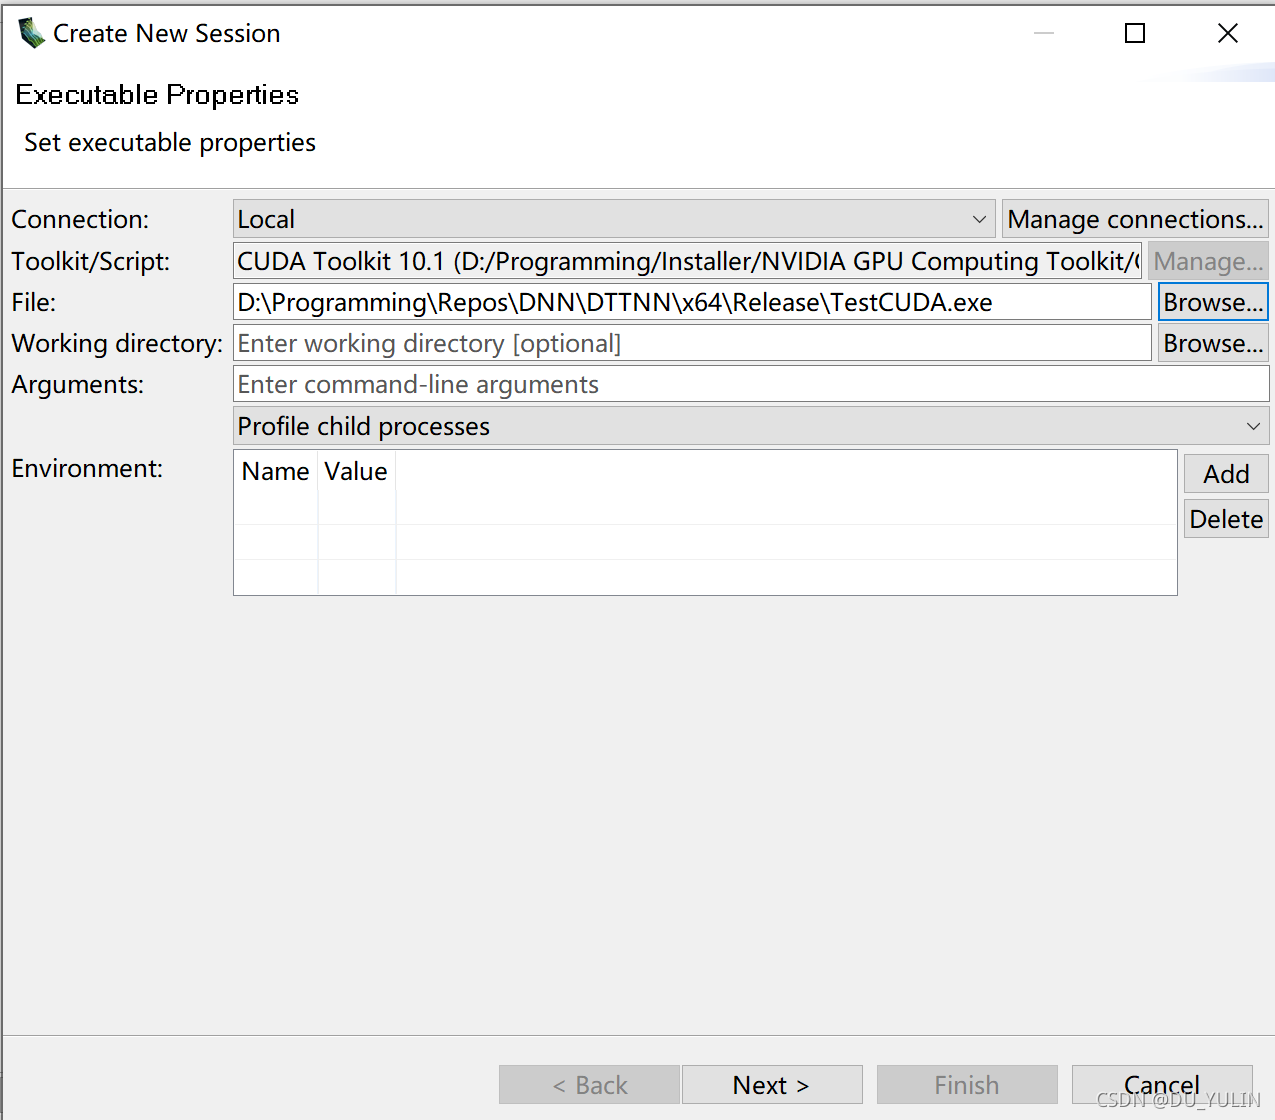
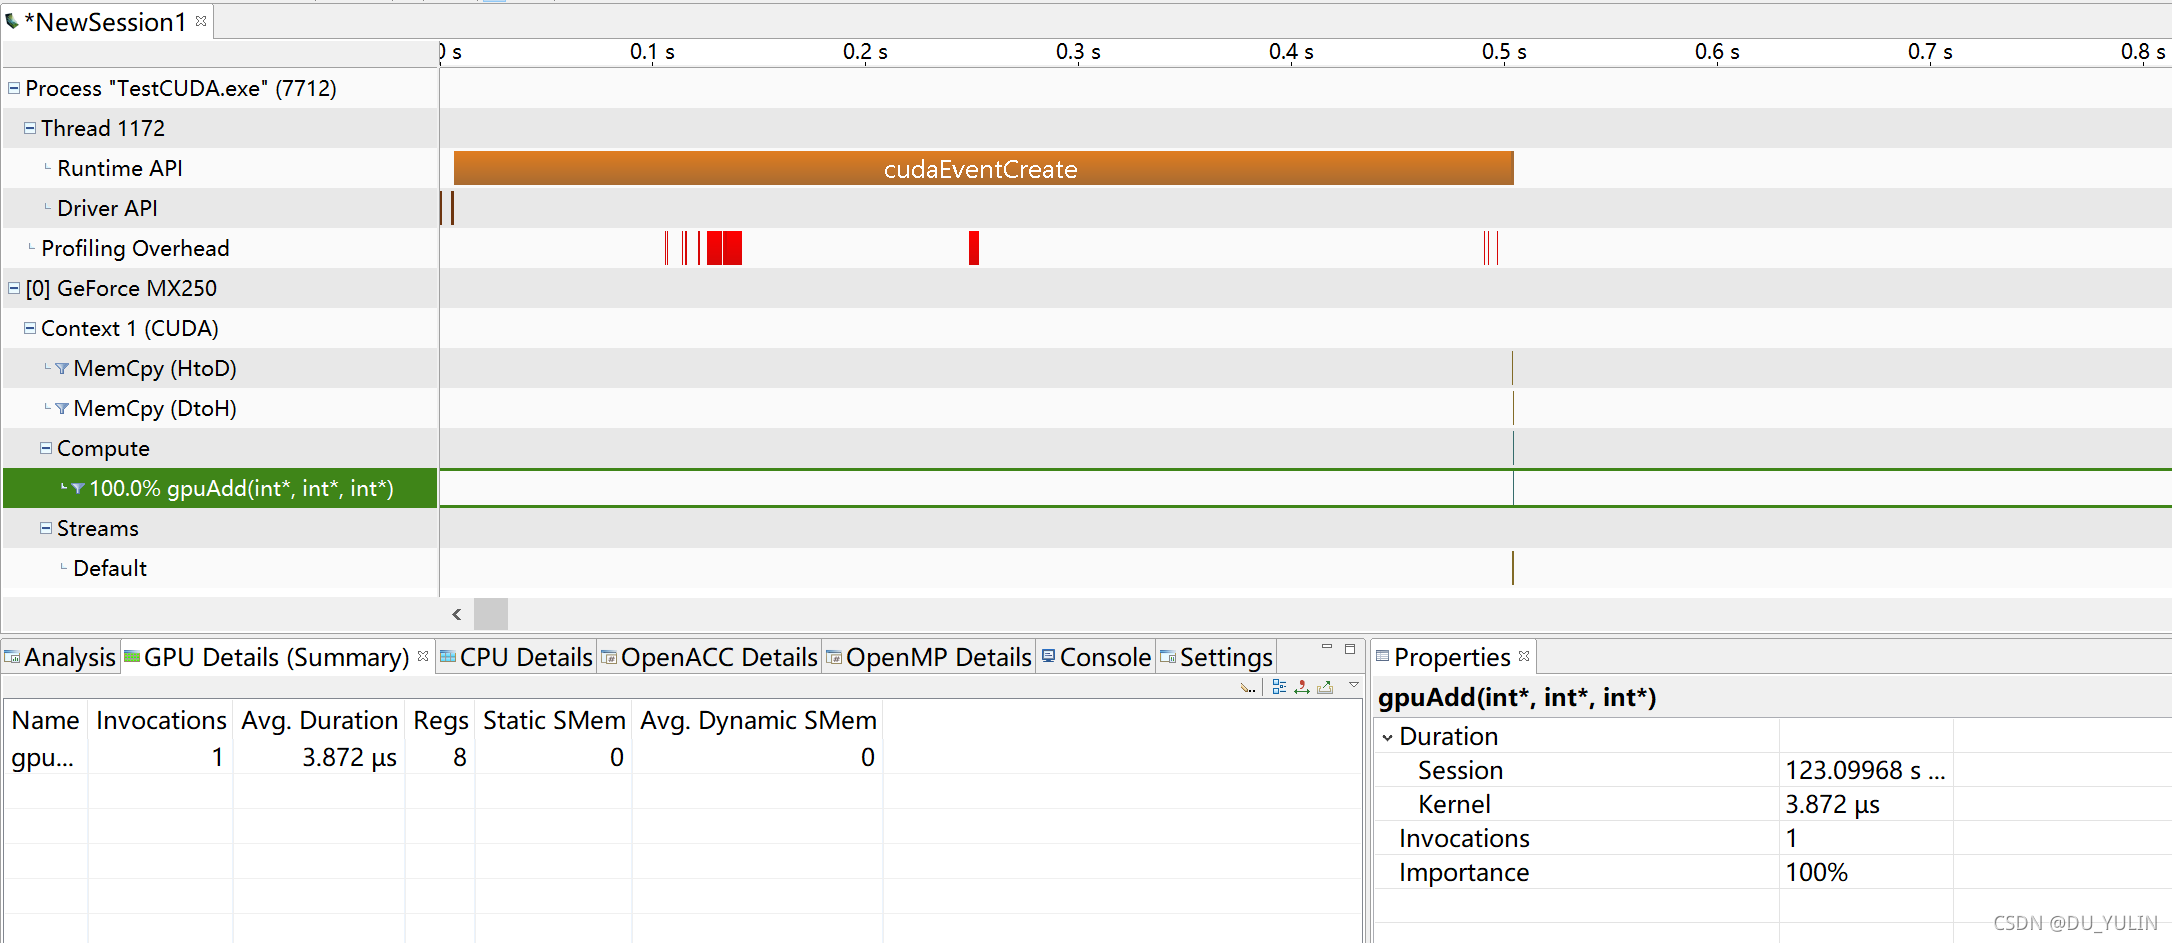
4. NVIDIA Visual Profiler工具
该工具可以用来分析cuda程序的具体运行时间,包括每一段的执行时间,比如cudaMemcpy, 内核函数等,该工具对于分析cuda程序并优化程序的执行过程
该工具的用法步骤如下:
- 在File菜单栏选择New Session,然后选择cuda程序:
- 在Console窗口根据提示继续操作,这里提示“请按任意键继续”:
 3. 分析cuda程序的执行时间,进而优化cuda程序的执行过程。
总结
之前的学习中没有对cuda程序运行时间进行统计过,这里给出了统计方法的cuda API和可视化工具方法的简单介绍,如果大家想了解的更深入,只能大家自己找资料了,本人小菜鸟一枚,上述描述如有失误,欢迎大神指教!
学习资料
《基于GPU加速的计算机视觉编程》