数组是如何绘制表格的?
我们先将两个数组传入np.meshgrid(),查看该函数是如何绘制网格的。
import numpy as np

x = np.linspace(-2, 2, 5)
y = np.linspace(-2, 2, 5)

X, Y = np.meshgrid(x, y)
Z = X**2 + Y**2 - 1

print("X显示:","\n",X)
print("Y显示:","\n",Y)
输出的结果是:
X显示:
 [[-2. -1.  0.  1.  2.]
 [-2. -1.  0.  1.  2.]
 [-2. -1.  0.  1.  2.]
 [-2. -1.  0.  1.  2.]
 [-2. -1.  0.  1.  2.]]
Y显示:
 [[-2. -2. -2. -2. -2.]
 [-1. -1. -1. -1. -1.]
 [ 0.  0.  0.  0.  0.]
 [ 1.  1.  1.  1.  1.]
 [ 2.  2.  2.  2.  2.]]
通过观察我们发现,经过X, Y = np.meshgrid(x, y)操作,它将我们的x数据纵向复制了5份,而将Y 转置之后横向复制了5份。
分别绘制X和Y图像
import matplotlib.pyplot as plt
import numpy as np
x = np.linspace(-2, 2, 5)
y = np.linspace(-2, 2, 5)
X, Y = np.meshgrid(x, y)
Z = X**2 + Y**2 - 1
print("X显示:","\n",X)
print("Y显示:","\n",Y)
plt.figure()
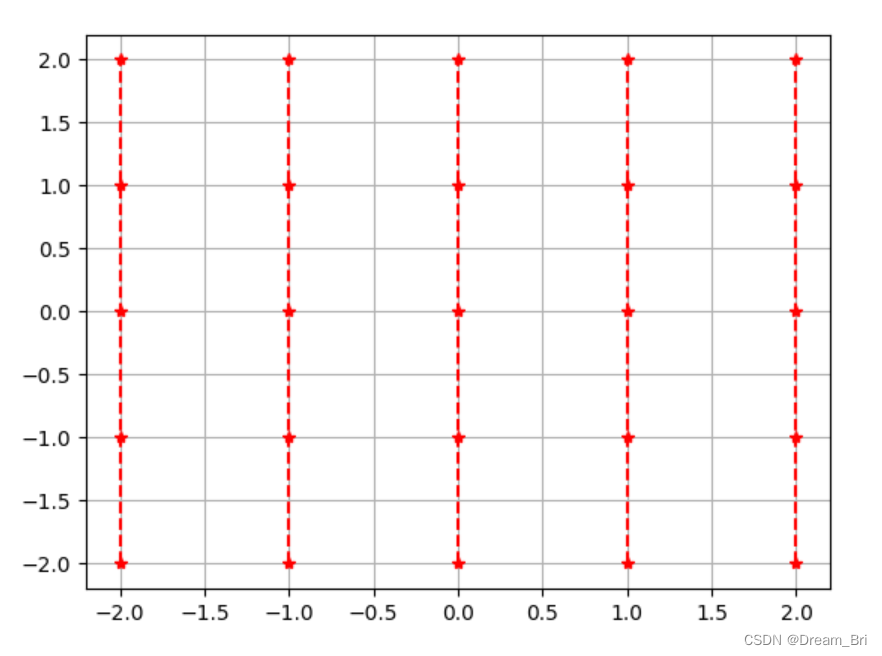
plt.plot(X, Y, color='red',marker='*',linestyle='--')
plt.grid(True)
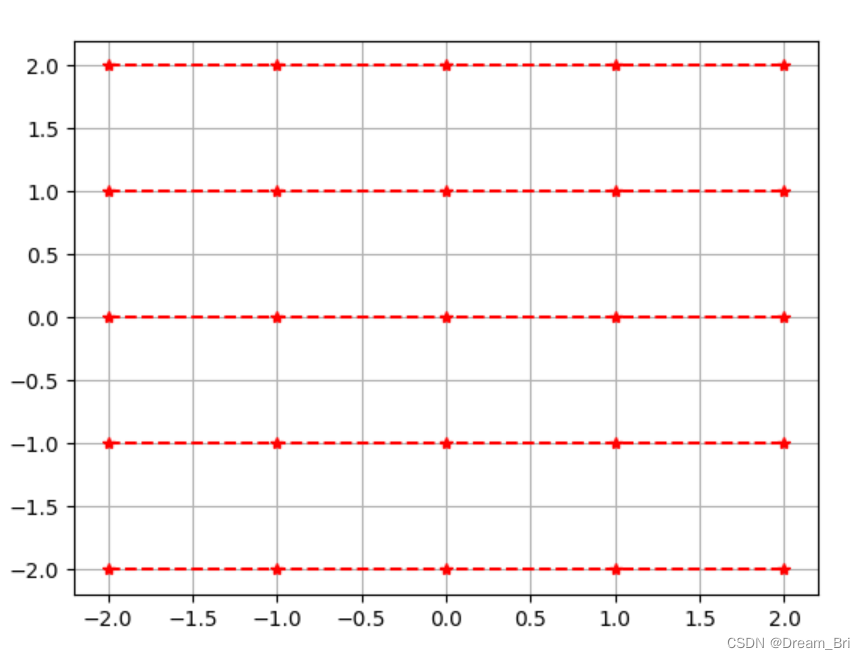
X, Y = np.meshgrid(x, y,indexing='ij')
Z = X**2 + Y**2 - 1
plt.figure()
plt.plot(X, Y, color='red',marker='*',linestyle='--')
plt.grid(True)
plt.show()
绘制出来的结果显示为:
绘制等高线
import matplotlib.pyplot as plt
import numpy as np
x = np.linspace(-2, 2, 5)
y = np.linspace(-2, 2, 5)
X, Y = np.meshgrid(x, y,indexing='ij')
Z = X**2 + Y**2 - 1
plt.figure()
plt.plot(X, Y, color='red',marker='*',linestyle='--')
plt.grid(True)
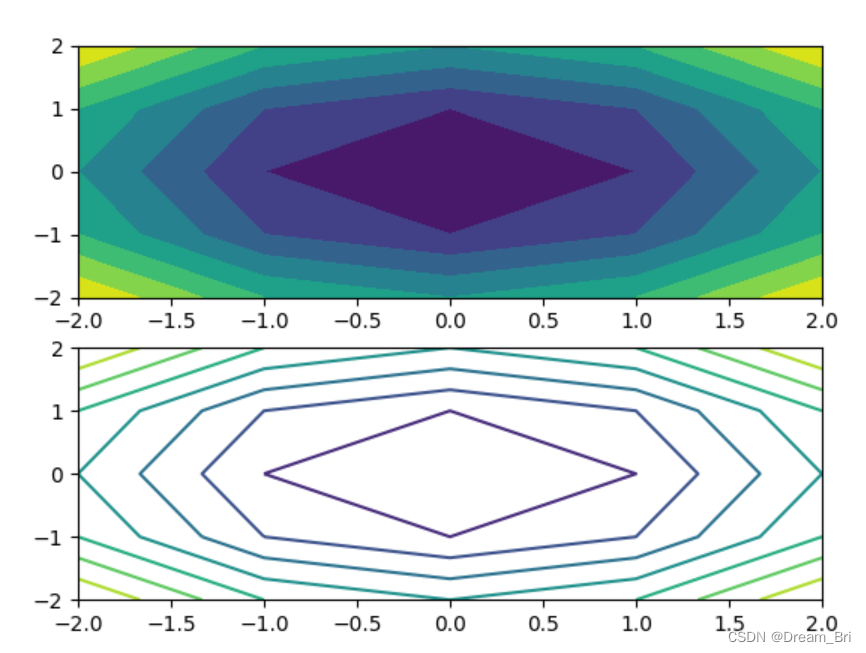
fig, (ax1, ax2) = plt.subplots(2)
ax1.contourf(X, Y, Z)
ax2.contour(X, Y, Z) # 与contourf区别在于不同高度面不填充颜色
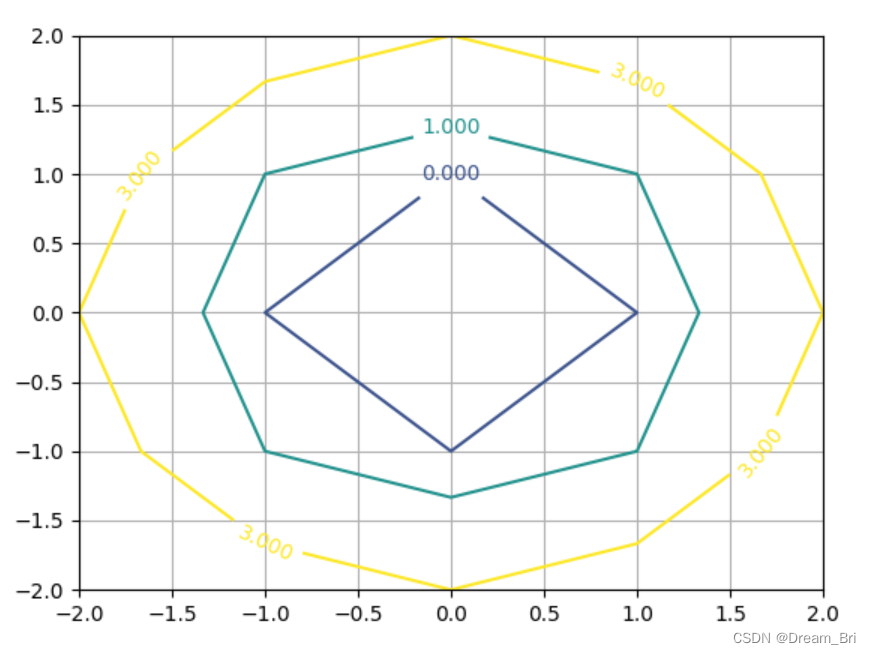
plt.figure()
ax = plt.gca()
cor = ax.contour(X, Y, Z, [-1, 0, 1, 3])
plt.clabel(cor, fontsize=10)
plt.grid(True)
plt.show()
图像显示如下:
参考:
https://blog.csdn.net/goodgoodstudyddp/article/details/106436558
https://blog.csdn.net/qq_38701868/article/details/99694048