—生成网格点坐标矩阵。
关键词:网格点,坐标矩阵
网格点是什么?坐标矩阵又是什么鬼?
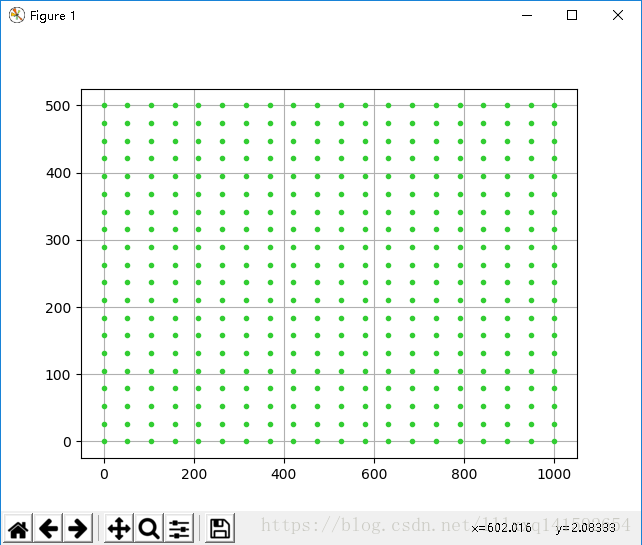
看个图就明白了:
图中,每个交叉点都是网格点,描述这些网格点的坐标的矩阵,就是坐标矩阵。
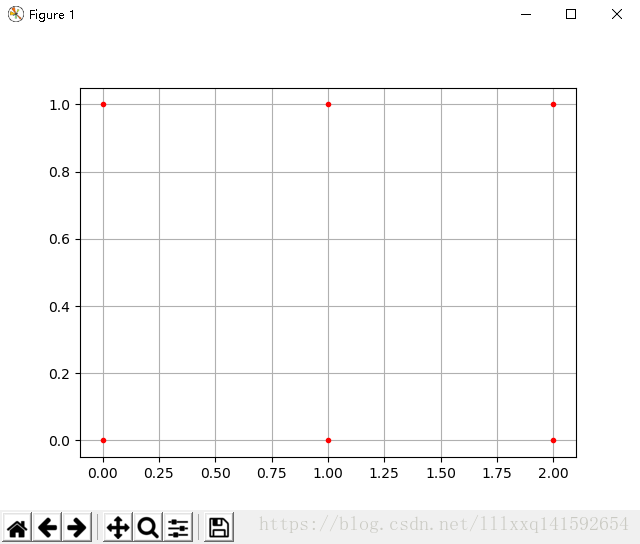
再看个简单例子
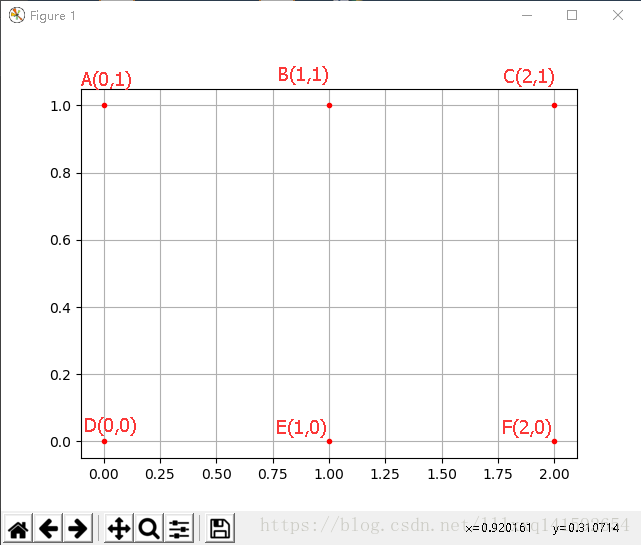
A,B,C,D,E,F是6个网格点,坐标如图,如何用矩阵形式(坐标矩阵)来批量描述这些点的坐标呢?
答案如下:
(X12,Y12)=(1,1)。
下面可以自己用matplotlib来试一试,输出就是上边的图
import numpy as np
import matplotlib.pyplot as plt
x = np.array([[0, 1, 2], [0, 1, 2]])
y = np.array([[0, 0, 0], [1, 1, 1]])
plt.plot(x, y,
color=‘red’, # 全部点设置为红色
marker=’.’, # 点的形状为圆点
linestyle=’’) # 线型为空,也即点与点之间不用线连接
plt.grid(True)
plt.show()
如果对matplotlib不熟悉,可能只知道用一列横坐标(线性代数中的1维列向量),一列纵坐标生成(两者元素个数相等)一些点。但是实际上,给matplotlib的坐标信息是矩阵也是可以的,只要横纵坐标的尺寸一样。都会按照对应关系生成点。
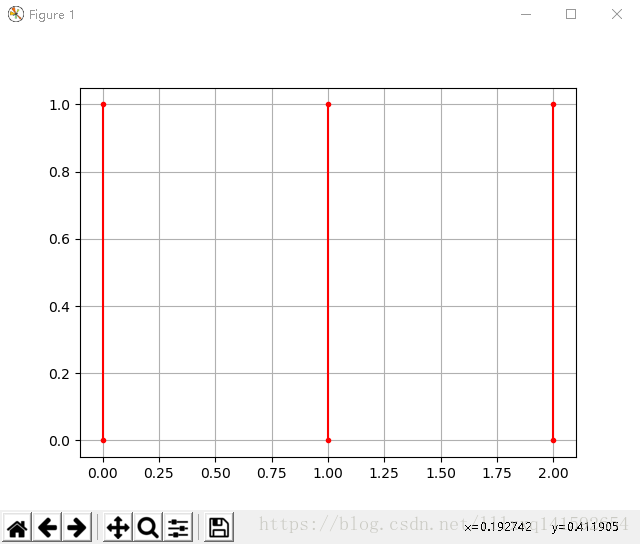
但是有需要注意的地方,按照矩阵给坐标点信息,matplotlib会把横坐标矩阵中,每一列对应的点当做同一条线。
举个例子,把上面的代码plot的linestyle=''删掉,或者变成linestyle='-'(这个操作把图的线型改为默认状态),就会发现A-D是连接的,B-E是连接的,C-F是连接的,也即,会认为你输入的是3条线,如图
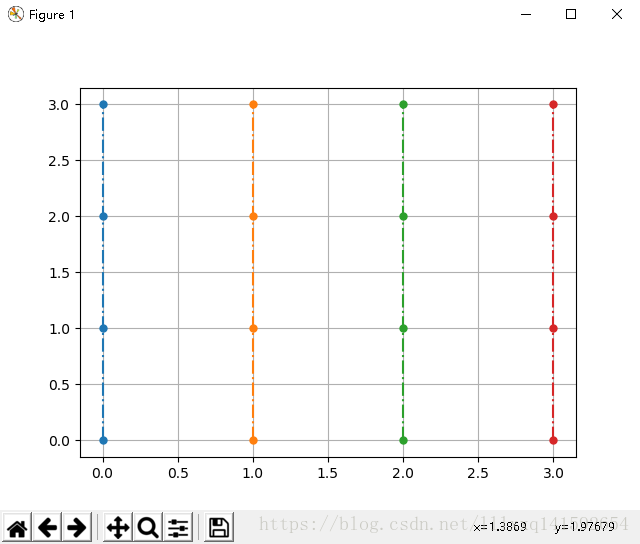
作为练习,自己试着生成如下结果
提示:线型等关键字参数设置可用如下代码
plt.plot(x, y,
         marker='.',  # 点的形状为圆点
         markersize=10,  # 点设置大一点,看着清楚
         linestyle='-.')  # 线型为点划线
- 1
- 2
- 3
- 4
答案
import numpy as np
import matplotlib.pyplot as plt
x = np.array([[0, 1, 2, 3],
[0, 1, 2, 3],
[0, 1, 2, 3],
[0, 1, 2, 3]])
y = np.array([[0, 0, 0, 0],
[1, 1, 1, 1],
[2, 2, 2, 2],
[3, 3, 3, 3]])
plt.plot(x, y,
marker=’.’, # 点的形状为圆点
markersize=10, # 点设置大一点,看着清楚
linestyle=’-.’) # 线型为点划线
plt.grid(True)
plt.show()
到这里,网格点和坐标矩阵的概念就解释清楚了。
那么问题来了,如果需要的图比较大,需要大量的网格点该怎么办呢?比如下面的这种
最直接但是最笨的方法,就是按照上面的方法把横纵坐标矩阵
Y。
语法:X,Y = numpy.meshgrid(x, y)
输入的x,y,就是网格点的横纵坐标列向量(非矩阵)
输出的X,Y,就是坐标矩阵。
我们来试验一下:改写第一个例子中的代码,用numpy.meshgrid来实现。
import numpy as np
import matplotlib.pyplot as plt
x = np.array([0, 1, 2])
y = np.array([0, 1])
X, Y = np.meshgrid(x, y)
print(X)
print(Y)
plt.plot(X, Y,
color=‘red’, # 全部点设置为红色
marker=’.’, # 点的形状为圆点
linestyle=’’) # 线型为空,也即点与点之间不用线连接
plt.grid(True)
plt.show()
# 从输出的结果来看,两种方法生成的坐标矩阵一毛一样。
[[0 1 2]
 [0 1 2]]
[[0 0 0]
 [1 1 1]]
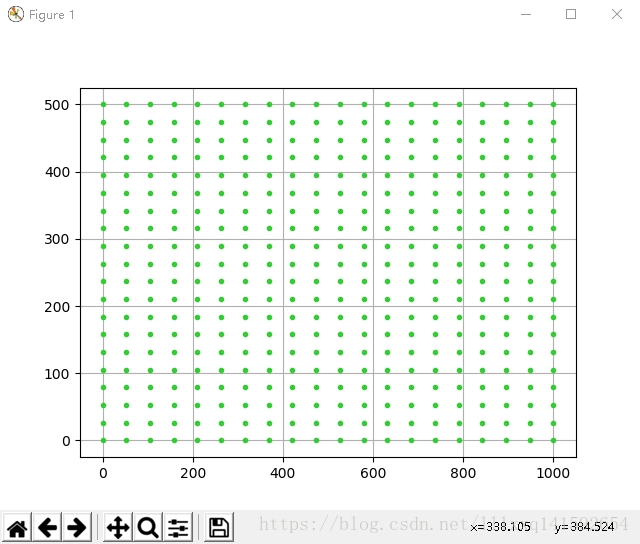
最后给出上面这个图的代码
import numpy as np
import matplotlib.pyplot as plt
x = np.linspace(0,1000,20)
y = np.linspace(0,500,20)
X,Y = np.meshgrid(x, y)
plt.plot(X, Y,
color=‘limegreen’, # 设置颜色为limegreen
marker=’.’, # 设置点类型为圆点
linestyle=’’) # 设置线型为空,也即没有线连接点
plt.grid(True)
plt.show()
参考文献
https://www.cnblogs.com/black-mamba/p/9186965.html
留下您的评论,我可以做得更好!
Self-Discipline and Social Commitment